Unlock a world of possibilities! Login now and discover the exclusive benefits awaiting you.
- Qlik Community
- :
- All Forums
- :
- QlikView App Dev
- :
- Scatter chart plotting for multiple dimensions
- Subscribe to RSS Feed
- Mark Topic as New
- Mark Topic as Read
- Float this Topic for Current User
- Bookmark
- Subscribe
- Mute
- Printer Friendly Page
- Mark as New
- Bookmark
- Subscribe
- Mute
- Subscribe to RSS Feed
- Permalink
- Report Inappropriate Content
Scatter chart plotting for multiple dimensions
I am planning to use scatter plot chart for couple of requirements
1. I need multiple dimensions to be viewed in x axis using a dropdown.So that i can dynamically choose the x axis dimension using dropdown.
2. Also , based on country and different status('Active,Closed') i need to plot the chart .Example:
X-axis values - Num of daya (0,40,60...)
Y axis value - Number of defects(0,1,2,3,....)
Status - Active(Triangular shape) , Closed (Square shape)
Country - US (Green color)
Now suppose for US region we have 2 active defects for past 40 days. It would be represented in chart with triangular shape filled with green color in proper x,y coordinates.
Kindly let me know if it is possible in qlikview using scatter chart or any other chart.
Thanks in advance for any guidance.
- Tags:
- new_to_qlikview
- Mark as New
- Bookmark
- Subscribe
- Mute
- Subscribe to RSS Feed
- Permalink
- Report Inappropriate Content
Hi ,
1. You can use many dimension but you have to work around to do that.i.e)You have load dimensions inline and you have to create variable ,write if statement based on dropdown values.And assign that variable to dimension in chart.
2.Color change and size change is possible but not shape change.Size change is done by assigning your expression as chart's 3rd expression.Color change is possible if write RGB with your own formula.
- Mark as New
- Bookmark
- Subscribe
- Mute
- Subscribe to RSS Feed
- Permalink
- Report Inappropriate Content
It is not possible to use multiple shapes in scatter chart ? I am atatching image to show what is required.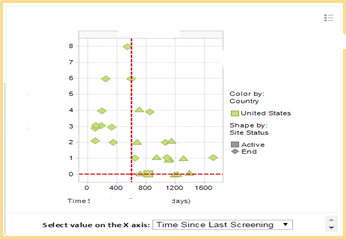
- Mark as New
- Bookmark
- Subscribe
- Mute
- Subscribe to RSS Feed
- Permalink
- Report Inappropriate Content
To my knowledge it is not possible..wait for others to reply will see any other idea's is there..!!
- Mark as New
- Bookmark
- Subscribe
- Mute
- Subscribe to RSS Feed
- Permalink
- Report Inappropriate Content