Unlock a world of possibilities! Login now and discover the exclusive benefits awaiting you.
Announcements
April 13–15 - Dare to Unleash a New Professional You at Qlik Connect 2026: Register Now!
- Qlik Community
- :
- All Forums
- :
- QlikView App Dev
- :
- Show Values on specified Data Point in Line Chart
Options
- Subscribe to RSS Feed
- Mark Topic as New
- Mark Topic as Read
- Float this Topic for Current User
- Bookmark
- Subscribe
- Mute
- Printer Friendly Page
Turn on suggestions
Auto-suggest helps you quickly narrow down your search results by suggesting possible matches as you type.
Showing results for
Partner - Creator II
2012-09-26
09:00 AM
- Mark as New
- Bookmark
- Subscribe
- Mute
- Subscribe to RSS Feed
- Permalink
- Report Inappropriate Content
Show Values on specified Data Point in Line Chart
Hi,
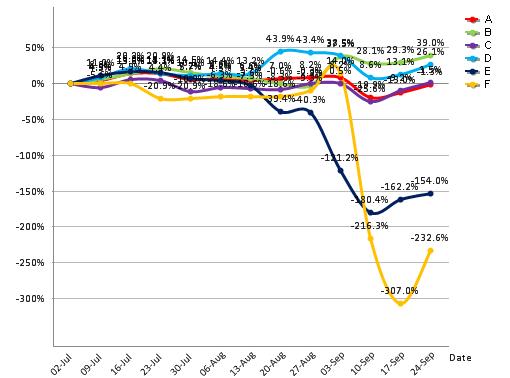
Can some one suggest me on the below requirement. The requirement is to show the values for only 1st date of every month and also the latest date available (here in the below graph vaues should be shown for only 02-Jul, 06-Aug,03-Sep and 24-Sep)
Regards,
Santhosh
437 Views
1 Reply
Master II
2012-09-26
11:44 AM
- Mark as New
- Bookmark
- Subscribe
- Mute
- Subscribe to RSS Feed
- Permalink
- Report Inappropriate Content
Hi.
If you expand the '+' to the left of your expression, you'll see 'Show value'.
There you can write an expression (like a condition to show a chart).
322 Views