Unlock a world of possibilities! Login now and discover the exclusive benefits awaiting you.
- Qlik Community
- :
- All Forums
- :
- QlikView App Dev
- :
- Textbox formula linked to Container Chart Object
- Subscribe to RSS Feed
- Mark Topic as New
- Mark Topic as Read
- Float this Topic for Current User
- Bookmark
- Subscribe
- Mute
- Printer Friendly Page
- Mark as New
- Bookmark
- Subscribe
- Mute
- Subscribe to RSS Feed
- Permalink
- Report Inappropriate Content
Textbox formula linked to Container Chart Object
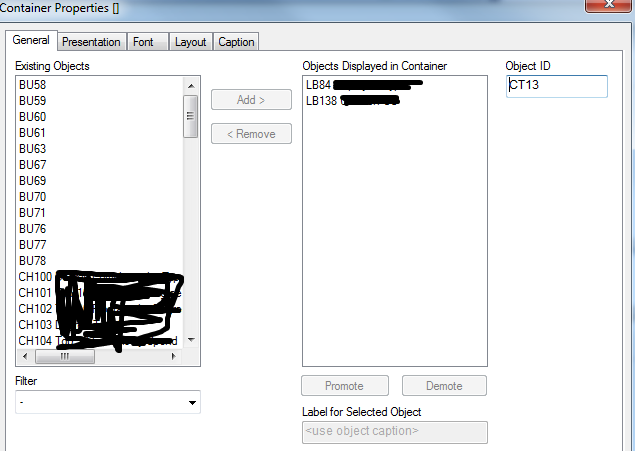
I have a container CT01
I have a number of charts within the container CH01 to CH10
I also need a textbox that displays various results in similar to the statistic box but containing formulas not available in the statsistcs box.
I need to be able to link the text box to the chart
CH01 - TX01
CH02 - TX02
How can I only show the relevant textbox only when the relevant chart is selected.
Regards
- « Previous Replies
-
- 1
- 2
- Next Replies »
- Mark as New
- Bookmark
- Subscribe
- Mute
- Subscribe to RSS Feed
- Permalink
- Report Inappropriate Content
what I am talking about here is...if you have 5 charts in your container and only one is activated at a time then how would you get the objectID of that chart???
- Mark as New
- Bookmark
- Subscribe
- Mute
- Subscribe to RSS Feed
- Permalink
- Report Inappropriate Content
In a container also we can know which object has what obj id. If one is finding it too difficult to get an object id from a container then remove that object and get it's ID.
Also please help me understand what do you mean by 'ACTIVATED'?
- Mark as New
- Bookmark
- Subscribe
- Mute
- Subscribe to RSS Feed
- Permalink
- Report Inappropriate Content
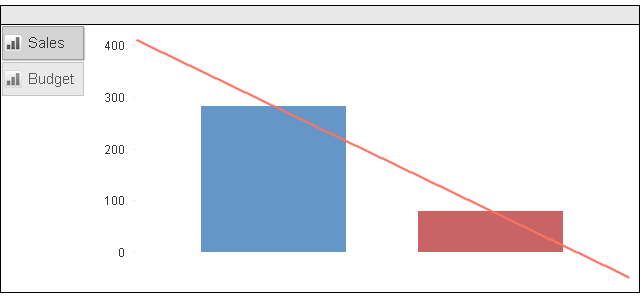
Hope this explains it better...In the screenshot i have 2 objects in a container where My 'Sales' chart is activated currently and 'Budget' is not.
- Mark as New
- Bookmark
- Subscribe
- Mute
- Subscribe to RSS Feed
- Permalink
- Report Inappropriate Content
The condition can still be applied by taking the dimension of the chart which you want to activate/hide/show etc.
there is always a way to see the Obj ID and I'd find it ridiculous if someone says I cannot get the Object ID of an Object.
We can get Obj ID in Sense and this is Qlik view.
If it is much of a hassles then before adding the object to container get the obj id and then add it. Anyway, I like to think I can get Object ID before or after adding it to container and apply any functionality to only that object in container (which will not effect other objects)
Thanks for your explanation.
- Mark as New
- Bookmark
- Subscribe
- Mute
- Subscribe to RSS Feed
- Permalink
- Report Inappropriate Content
I never said that its hard to get ID of an object.
The question here is how you can find which object is currently activated in the container and get ID of that.
And there are more people in community who could answer this better.
- Mark as New
- Bookmark
- Subscribe
- Mute
- Subscribe to RSS Feed
- Permalink
- Report Inappropriate Content
So there doesn't seem to a way of doing this.
I will therefore have to remove the charts from the container and show them all across multiple sheets along with a textbox Statiticsbox containing my formulas for each chart.
Another way of doing this is to reorganize my data.
currently for example my data is from a spreadsheet organised like this
| Batch | Ratio | RatioUL | RatioLL | Bioburden | BioburdenUL | BioburdenLL |
| AB1234 | 80 | 95 | 55 | 108 | 130 | 100 |
| AB1235 | 81 | 95 | 55 | 107 | 130 | 100 |
| AB1236 | 67 | 95 | 55 | 124 | 130 | 100 |
| AB1237 | 66 | 95 | 55 | 113 | 130 | 100 |
| AB1238 | 69 | 95 | 55 | 123 | 130 | 100 |
| AB1239 | 66 | 95 | 55 | 123 | 130 | 100 |
| AB1240 | 68 | 95 | 55 | 114 | 130 | 100 |
| AB1241 | 50 | 95 | 55 | 123 | 130 | 100 |
| AB1242 | 74 | 95 | 55 | 109 | 130 | 100 |
| AB1243 | 90 | 95 | 55 | 116 | 130 | 100 |
| AB1244 | 57 | 95 | 55 | 105 | 130 | 100 |
| AB1245 | 89 | 95 | 55 | 108 | 130 | 100 |
| AB1246 | 58 | 95 | 55 | 121 | 130 | 100 |
| AB1247 | 87 | 95 | 55 | 120 | 130 | 100 |
| AB1248 | 86 | 95 | 55 | 125 | 130 | 100 |
| AB1249 | 69 | 95 | 55 | 106 | 130 | 100 |
| AB1250 | 84 | 95 | 55 | 120 | 130 | 100 |
| AB1251 | 65 | 95 | 55 | 113 | 130 | 100 |
| AB1252 | 53 | 95 | 55 | 117 | 130 | 100 |
| AB1253 | 56 | 95 | 55 | 106 | 130 | 100 |
| AB1254 | 75 | 95 | 55 | 105 | 130 | 100 |
| AB1255 | 68 | 95 | 55 | 123 | 130 | 100 |
| AB1256 | 55 | 95 | 55 | 118 | 130 | 100 |
| AB1257 | 60 | 95 | 55 | 124 | 130 | 100 |
| AB1258 | 54 | 95 | 55 | 116 | 130 | 100 |
I would need it organised like this
| Batch | Test | Value | UL | LL |
| AB1234 | Ratio | 82 | 95 | 55 |
| AB1235 | Ratio | 67 | 95 | 55 |
| AB1236 | Ratio | 53 | 95 | 55 |
| AB1237 | Ratio | 52 | 95 | 55 |
| AB1238 | Ratio | 73 | 95 | 55 |
| AB1239 | Ratio | 50 | 95 | 55 |
| AB1240 | Ratio | 76 | 95 | 55 |
| AB1241 | Ratio | 78 | 95 | 55 |
| AB1242 | Ratio | 53 | 95 | 55 |
| AB1243 | Ratio | 73 | 95 | 55 |
| AB1244 | Ratio | 70 | 95 | 55 |
| AB1245 | Ratio | 66 | 95 | 55 |
| AB1246 | Ratio | 77 | 95 | 55 |
| AB1247 | Ratio | 68 | 95 | 55 |
| AB1248 | Ratio | 80 | 95 | 55 |
| AB1249 | Ratio | 81 | 95 | 55 |
| AB1250 | Ratio | 64 | 95 | 55 |
| AB1251 | Ratio | 59 | 95 | 55 |
| AB1252 | Ratio | 84 | 95 | 55 |
| AB1253 | Ratio | 67 | 95 | 55 |
| AB1254 | Ratio | 52 | 95 | 55 |
| AB1255 | Ratio | 77 | 95 | 55 |
| AB1256 | Ratio | 69 | 95 | 55 |
| AB1257 | Ratio | 77 | 95 | 55 |
| AB1258 | Ratio | 56 | 95 | 55 |
| AB1234 | Bioburden | 117 | 130 | 100 |
| AB1235 | Bioburden | 112 | 130 | 100 |
| AB1236 | Bioburden | 117 | 130 | 100 |
| AB1237 | Bioburden | 111 | 130 | 100 |
| AB1238 | Bioburden | 110 | 130 | 100 |
| AB1239 | Bioburden | 110 | 130 | 100 |
| AB1240 | Bioburden | 108 | 130 | 100 |
| AB1241 | Bioburden | 121 | 130 | 100 |
| AB1242 | Bioburden | 118 | 130 | 100 |
| AB1243 | Bioburden | 111 | 130 | 100 |
| AB1244 | Bioburden | 122 | 130 | 100 |
| AB1245 | Bioburden | 110 | 130 | 100 |
| AB1246 | Bioburden | 114 | 130 | 100 |
| AB1247 | Bioburden | 124 | 130 | 100 |
| AB1248 | Bioburden | 125 | 130 | 100 |
| AB1249 | Bioburden | 112 | 130 | 100 |
| AB1250 | Bioburden | 105 | 130 | 100 |
| AB1251 | Bioburden | 125 | 130 | 100 |
| AB1252 | Bioburden | 116 | 130 | 100 |
| AB1253 | Bioburden | 119 | 130 | 100 |
| AB1254 | Bioburden | 112 | 130 | 100 |
| AB1255 | Bioburden | 117 | 130 | 100 |
| AB1256 | Bioburden | 112 | 130 | 100 |
| AB1257 | Bioburden | 120 | 130 | 100 |
| AB1258 | Bioburden | 108 | 130 | 100 |
Obviously this is just an example
I have about 30 columns to reorganize
Is this practical or is a case of show multilpe charts alongside multiple textboxes
- « Previous Replies
-
- 1
- 2
- Next Replies »