Unlock a world of possibilities! Login now and discover the exclusive benefits awaiting you.
Announcements
FLASH SALE: Save $500! Use code FLASH2026 at checkout until Feb 14th at 11:59PM ET. Register Now!
- Qlik Community
- :
- All Forums
- :
- QlikView App Dev
- :
- Trendline
Options
- Subscribe to RSS Feed
- Mark Topic as New
- Mark Topic as Read
- Float this Topic for Current User
- Bookmark
- Subscribe
- Mute
- Printer Friendly Page
Turn on suggestions
Auto-suggest helps you quickly narrow down your search results by suggesting possible matches as you type.
Showing results for
Partner - Creator
2016-04-13
11:55 AM
- Mark as New
- Bookmark
- Subscribe
- Mute
- Subscribe to RSS Feed
- Permalink
- Report Inappropriate Content
Trendline
Hi!
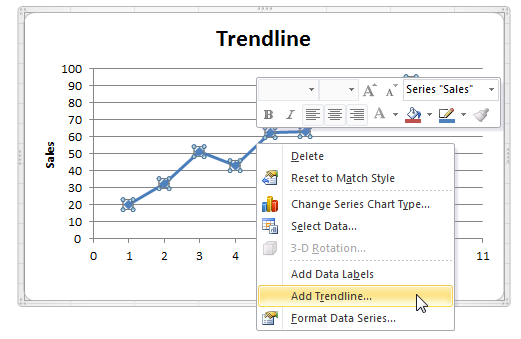
I need to do a tredline like in Excel.
Best regards,
Agustin
838 Views
1 Solution
Accepted Solutions
Partner - Champion III
2016-04-13
12:43 PM
- Mark as New
- Bookmark
- Subscribe
- Mute
- Subscribe to RSS Feed
- Permalink
- Report Inappropriate Content
Open the Properties window of the chart and go to the Expressions tab. Select the expression you want to add a trendline for. Then enable one of the Trendline options in the lower left corner of the properties window.
talk is cheap, supply exceeds demand
2 Replies
Partner - Champion III
2016-04-13
12:43 PM
- Mark as New
- Bookmark
- Subscribe
- Mute
- Subscribe to RSS Feed
- Permalink
- Report Inappropriate Content
Open the Properties window of the chart and go to the Expressions tab. Select the expression you want to add a trendline for. Then enable one of the Trendline options in the lower left corner of the properties window.
talk is cheap, supply exceeds demand
Partner - Creator
2016-04-13
12:51 PM
Author
- Mark as New
- Bookmark
- Subscribe
- Mute
- Subscribe to RSS Feed
- Permalink
- Report Inappropriate Content
Thanks! I never pay attention to these options! 
740 Views