Unlock a world of possibilities! Login now and discover the exclusive benefits awaiting you.
- Qlik Community
- :
- All Forums
- :
- QlikView App Dev
- :
- Using set analysis
- Subscribe to RSS Feed
- Mark Topic as New
- Mark Topic as Read
- Float this Topic for Current User
- Bookmark
- Subscribe
- Mute
- Printer Friendly Page
- Mark as New
- Bookmark
- Subscribe
- Mute
- Subscribe to RSS Feed
- Permalink
- Report Inappropriate Content
Using set analysis
Hello,
i created this pivot table in which i applied Pareto method.
As you can see here there are values of acuracy [column 3] greater or equal than 80%. What i want to do is to keep only accuracy values less than 80%.
I heard that i can use set analysis in this case but i do not know how to use. Please, any help.
Thank you very much.
Best regards,
Alâa Eddine.

- Mark as New
- Bookmark
- Subscribe
- Mute
- Subscribe to RSS Feed
- Permalink
- Report Inappropriate Content
May be check this out
- Mark as New
- Bookmark
- Subscribe
- Mute
- Subscribe to RSS Feed
- Permalink
- Report Inappropriate Content
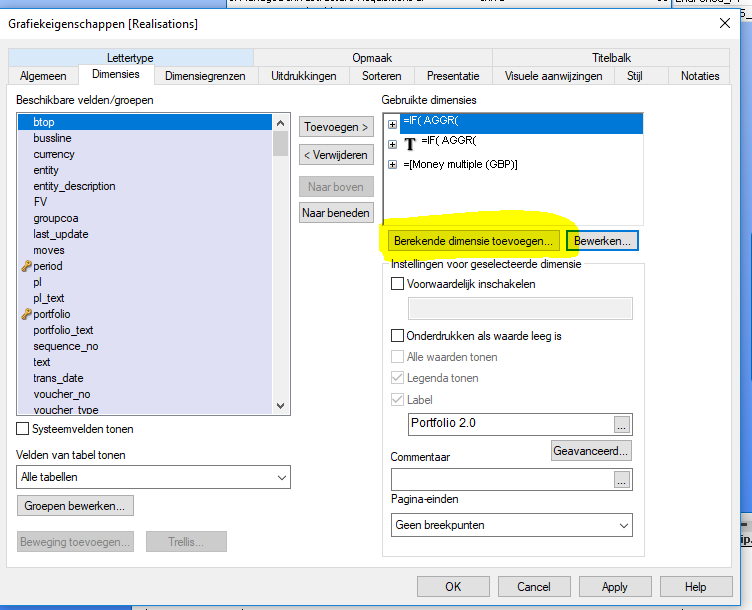
you could create a calculated dimension? Something like:
IF( AGGR(
//Your measure
, [Aggr Brand]) <= 0.8 , [Aggr Brand] )
After creating the dimension you select "suppress zero values"
- Mark as New
- Bookmark
- Subscribe
- Mute
- Subscribe to RSS Feed
- Permalink
- Report Inappropriate Content
Hello,
thank you but do you have an idea about set analysis? because i do not know how to use the aggr function.
Thank you,
Alâa Eddine
- Mark as New
- Bookmark
- Subscribe
- Mute
- Subscribe to RSS Feed
- Permalink
- Report Inappropriate Content
I don't think there is an easier way of fixing this than with the aggr function in either the dimension or the set analysis. If you are going to use Qlikview frequently, I suggest you look in to this. It is a powerful function.
https://help.qlik.com/en-US/sense/June2018/Subsystems/Hub/Content/ChartFunctions/aggr.htm
If you don’t have the time to dive into the matter maybe this is a solution:
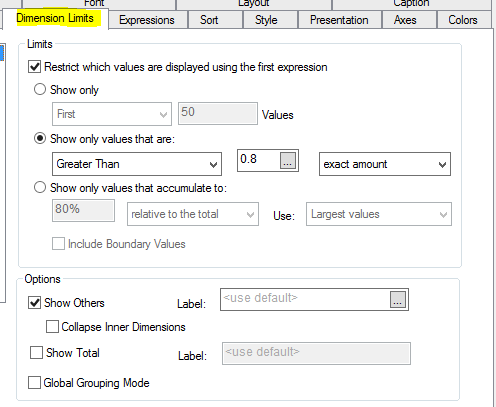
Change the pivot table to a straight table and set the dimension limits to only show values greater than 0.8