Unlock a world of possibilities! Login now and discover the exclusive benefits awaiting you.
Announcements
April 13–15 - Dare to Unleash a New Professional You at Qlik Connect 2026: Register Now!
- Qlik Community
- :
- All Forums
- :
- QlikView App Dev
- :
- Vertical Table
Options
- Subscribe to RSS Feed
- Mark Topic as New
- Mark Topic as Read
- Float this Topic for Current User
- Bookmark
- Subscribe
- Mute
- Printer Friendly Page
Turn on suggestions
Auto-suggest helps you quickly narrow down your search results by suggesting possible matches as you type.
Showing results for
Not applicable
2013-10-24
01:25 PM
- Mark as New
- Bookmark
- Subscribe
- Mute
- Subscribe to RSS Feed
- Permalink
- Report Inappropriate Content
Vertical Table
I am here again with another problem. I have this data in an Excel File:
| Title 1 | Title 2 | Title 3 | jun-13 |
| Primary | 1021080 | 5235500001 | 820724835 |
| Primary | 1021080 | 5235500006 | 654480574 |
| Primary | 1021080 | 5235500012 | 45696827 |
| Secundary | 1021080 | 5235500002 | 80371512 |
| Secundary | 1021080 | 5235500003 | 118080930 |
| Secundary | 1021080 | 5235500013 | 9463308 |
| TAT | 1021080 | 5235500007 | 222962791 |
| TAT | 1021080 | 5235500014 | 54330714 |
| TAT | 1021080 | 5235500015 | 12911312 |
| Derivable | 1021080 | 5235500008 | 189631760 |
| Devolutions | 1021080 | 5235500004 | 10313974 |
And I need to create a report with this structure and subtotals:
| Title 1 | Title 2 | Title 3 | jun-13 |
| Primary | 1021080 | 5235500001 | 820.724.835 |
| Primary | 1021080 | 5235500006 | 654.480.574 |
| Primary | 1021080 | 5235500012 | 45.696.827 |
| Total Primary | 1.520.902.236 | ||
| Secundary | 1021080 | 5235500002 | 80.371.512 |
| Secundary | 1021080 | 5235500003 | 118.080.930 |
| Secundary | 1021080 | 5235500013 | 9.463.308 |
| Total Secundary | 207.915.750 | ||
| TAT | 1021080 | 5235500007 | 222.962.791 |
| TAT | 1021080 | 5235500014 | 54.330.714 |
| TAT | 1021080 | 5235500015 | 12.911.312 |
| Total TAT | 290.204.817 | ||
| Derivable | 1021080 | 5235500008 | 189.631.760 |
| Total Derivable | 189.631.760 | ||
| Devolutions | 1021080 | 5235500004 | 10.313.974 |
| Total Devolutions | 10.313.974 | ||
| TOTAL | 2.218.968.537 |
Thanks.
420 Views
2 Replies
Not applicable
2013-10-24
01:44 PM
Author
- Mark as New
- Bookmark
- Subscribe
- Mute
- Subscribe to RSS Feed
- Permalink
- Report Inappropriate Content
The resulting structure is not quite the same but you could try a pivot table and apply partial sums at Title1/Title2 level:
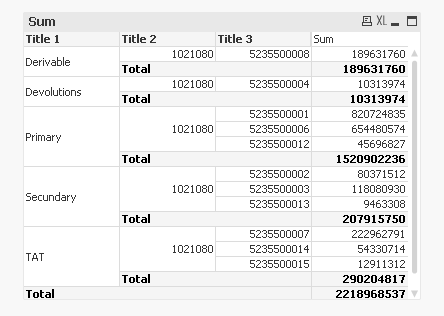
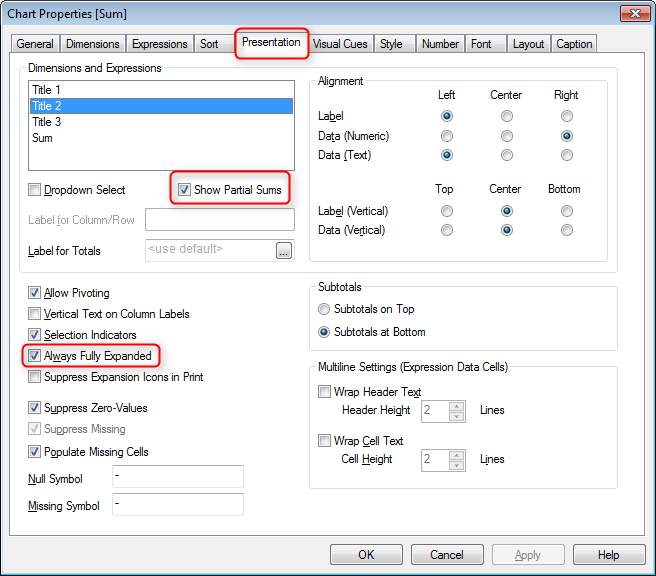
You could put a formula in "Label for Totals" above to apply custom labels.
In the above example Title1, Title2 and Title3 are dimensions, and column "Sum" is the expression sum([jun-13])
Not applicable
2013-10-25
12:19 PM
Author
- Mark as New
- Bookmark
- Subscribe
- Mute
- Subscribe to RSS Feed
- Permalink
- Report Inappropriate Content
Thanks Kai !!
305 Views