Unlock a world of possibilities! Login now and discover the exclusive benefits awaiting you.
- Qlik Community
- :
- All Forums
- :
- QlikView App Dev
- :
- Wrong Values displayed in the Grid Chart
- Subscribe to RSS Feed
- Mark Topic as New
- Mark Topic as Read
- Float this Topic for Current User
- Bookmark
- Subscribe
- Mute
- Printer Friendly Page
- Mark as New
- Bookmark
- Subscribe
- Mute
- Subscribe to RSS Feed
- Permalink
- Report Inappropriate Content
Wrong Values displayed in the Grid Chart
Dear Community,
I have an issue with the Grid Chart.
Dimensions:
Country
Year
Product
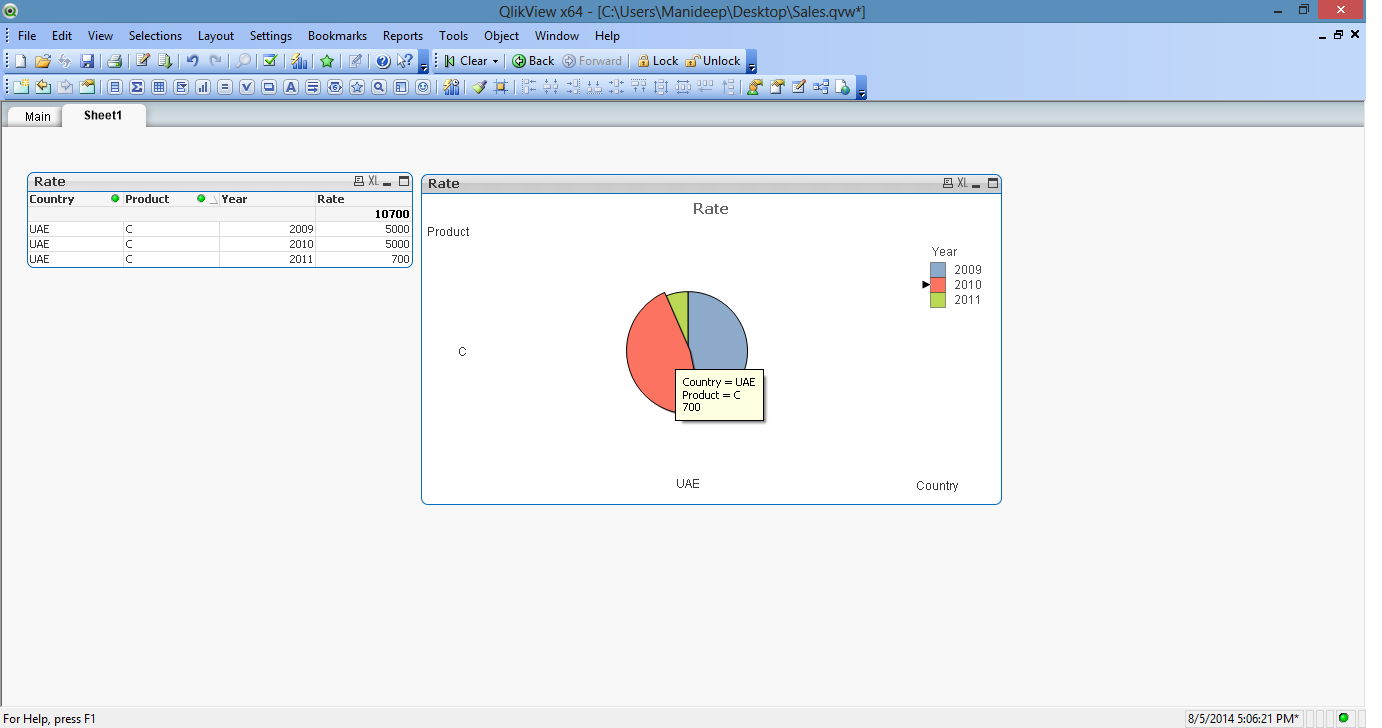
Expression =Sum(Sales).
As you can see in the below Grid Chart, the plot is splitting according to the values. But When I placing the cursor on any partition it showing 700 instead of corresponding values. When I place cursor on red it should display 5000, green =700, blue=500. But for every partition it is displaying 700.
Can you please help me where I am going wrong.
Thanks & Regards
Manideep
- Tags:
- gridchart
- show_values
- « Previous Replies
-
- 1
- 2
- Next Replies »
- Mark as New
- Bookmark
- Subscribe
- Mute
- Subscribe to RSS Feed
- Permalink
- Report Inappropriate Content
Yousef,
I wanted to check Sales for each product in the year for each Region (like pie chart.) so that I am using 3 dimensions here. It is appropriate that we can use 3 dimensions in this scenario.
- Mark as New
- Bookmark
- Subscribe
- Mute
- Subscribe to RSS Feed
- Permalink
- Report Inappropriate Content
use the bar chart instead, it's working, please see the attached file
- Mark as New
- Bookmark
- Subscribe
- Mute
- Subscribe to RSS Feed
- Permalink
- Report Inappropriate Content
Hi,
attached a example.
Ale
- Mark as New
- Bookmark
- Subscribe
- Mute
- Subscribe to RSS Feed
- Permalink
- Report Inappropriate Content
Hi,
Try the below expression
=Sum(Total Aggr(Sum(Sales),Year)
- Mark as New
- Bookmark
- Subscribe
- Mute
- Subscribe to RSS Feed
- Permalink
- Report Inappropriate Content
In your example, the pie chart shows correct values. But I need to see all those values at a time for all dimensions. So I took Grid Chart. If I Clear selections I could see all the Country, Product and Year as Dimensions. So I need sum(sales) for all those dimensions.
- Mark as New
- Bookmark
- Subscribe
- Mute
- Subscribe to RSS Feed
- Permalink
- Report Inappropriate Content
No Luck Soumya Jigajinni
- Mark as New
- Bookmark
- Subscribe
- Mute
- Subscribe to RSS Feed
- Permalink
- Report Inappropriate Content
Hi,
May be something like this.
Regards
ASHFAQ
- Mark as New
- Bookmark
- Subscribe
- Mute
- Subscribe to RSS Feed
- Permalink
- Report Inappropriate Content
check out this way.
Ale
- Mark as New
- Bookmark
- Subscribe
- Mute
- Subscribe to RSS Feed
- Permalink
- Report Inappropriate Content
I already tried this in the Pie Chart. Can't I get this in the Grid Chart?
- Mark as New
- Bookmark
- Subscribe
- Mute
- Subscribe to RSS Feed
- Permalink
- Report Inappropriate Content
Hi Alejandra,
I could get this with other charts. I am confirming that whether I can get this functionality in the Grid Chart. I think this is a bug in the Grid Chart. Thanks for the effort.
- « Previous Replies
-
- 1
- 2
- Next Replies »