Unlock a world of possibilities! Login now and discover the exclusive benefits awaiting you.
- Qlik Community
- :
- All Forums
- :
- QlikView App Dev
- :
- box plot creation problems
Options
- Subscribe to RSS Feed
- Mark Topic as New
- Mark Topic as Read
- Float this Topic for Current User
- Bookmark
- Subscribe
- Mute
- Printer Friendly Page
Turn on suggestions
Auto-suggest helps you quickly narrow down your search results by suggesting possible matches as you type.
Showing results for
Not applicable
2016-09-22
11:05 AM
- Mark as New
- Bookmark
- Subscribe
- Mute
- Subscribe to RSS Feed
- Permalink
- Report Inappropriate Content
box plot creation problems
Hi,
I'm struggling with the creation of a box plot chart.
| Date, | ID | Value |
| 1, | 1, | 0.6 |
| 1, | 2, | 0.7 |
| 1, | 3, | 0.7 |
| 1, | 4, | 0.8 |
| 1, | 5, | 0.7 |
| 1, | 6, | 0.5 |
| 1, | 7, | 0.5 |
| 1, | 8, | 0.8 |
| 1, | 9, | 0.6 |
| 1, | 10, | 0.7 |
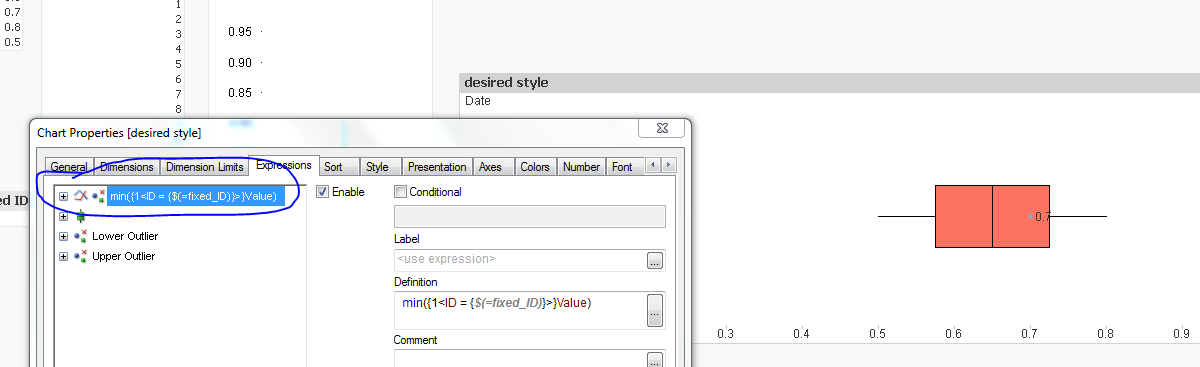
The box plot shall represent the distribution of the field "Value".
Overall the chart should look like the attached picture.
Is it possible to show expression: label and value at the belonging datapoint in the graph?
None of it seems to work for horizontal representation style.
See attached files.
Thank you 
915 Views
1 Solution
Accepted Solutions
MVP
2016-09-22
12:31 PM
- Mark as New
- Bookmark
- Subscribe
- Mute
- Subscribe to RSS Feed
- Permalink
- Report Inappropriate Content
Moving the expression to the top seems to have helped. Is this what you wanted?
747 Views
2 Replies
MVP
2016-09-22
12:31 PM
- Mark as New
- Bookmark
- Subscribe
- Mute
- Subscribe to RSS Feed
- Permalink
- Report Inappropriate Content
Moving the expression to the top seems to have helped. Is this what you wanted?
748 Views
Not applicable
2016-09-22
12:36 PM
Author
- Mark as New
- Bookmark
- Subscribe
- Mute
- Subscribe to RSS Feed
- Permalink
- Report Inappropriate Content
Hi Sunny, thank you. It's working now.
747 Views