Unlock a world of possibilities! Login now and discover the exclusive benefits awaiting you.
- Qlik Community
- :
- All Forums
- :
- QlikView App Dev
- :
- calculated dimensions
- Subscribe to RSS Feed
- Mark Topic as New
- Mark Topic as Read
- Float this Topic for Current User
- Bookmark
- Subscribe
- Mute
- Printer Friendly Page
- Mark as New
- Bookmark
- Subscribe
- Mute
- Subscribe to RSS Feed
- Permalink
- Report Inappropriate Content
calculated dimensions
i have a year dimension , I want this to work like this , year where cycle is current cycle and Last year at calculated dimensions , I want those years to show?
I have tried to give if conditions but no luck?
- Mark as New
- Bookmark
- Subscribe
- Mute
- Subscribe to RSS Feed
- Permalink
- Report Inappropriate Content
any response??
- Mark as New
- Bookmark
- Subscribe
- Mute
- Subscribe to RSS Feed
- Permalink
- Report Inappropriate Content
Can you please explain more?
- Mark as New
- Bookmark
- Subscribe
- Mute
- Subscribe to RSS Feed
- Permalink
- Report Inappropriate Content
my dimension is year that has 2016 and 2017 i have two set of data for 2017 ,
where 1st set of data is c1 and another set of data is c2 , so i have a field in my data is c that says c1 and c2 and for 2016 it says LY.
so i want to show bar graph where dimension is Year and i want to how 2016 data and 2017 data in that , that means 2017 I should point to c1 and 2016 should point to LY.
- Mark as New
- Bookmark
- Subscribe
- Mute
- Subscribe to RSS Feed
- Permalink
- Report Inappropriate Content
Can you please upload some sample data with expected output.
- Mark as New
- Bookmark
- Subscribe
- Mute
- Subscribe to RSS Feed
- Permalink
- Report Inappropriate Content
so for 2017, u have 2 sets:- c1, c2 where c1 is current dataset.
for 2016, u have only 1 set and that is LY...is this correct?
- Mark as New
- Bookmark
- Subscribe
- Mute
- Subscribe to RSS Feed
- Permalink
- Report Inappropriate Content
exactly
- Mark as New
- Bookmark
- Subscribe
- Mute
- Subscribe to RSS Feed
- Permalink
- Report Inappropriate Content
If you have dataset, like shown in image below :
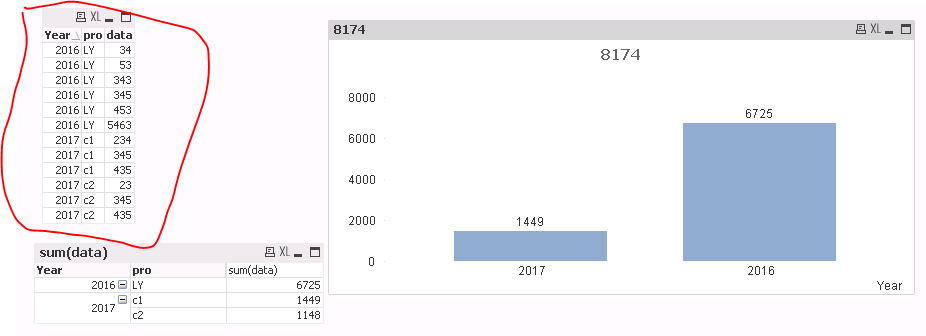
Please check attached qvw.