Unlock a world of possibilities! Login now and discover the exclusive benefits awaiting you.
Announcements
April 13–15 - Dare to Unleash a New Professional You at Qlik Connect 2026: Register Now!
- Qlik Community
- :
- All Forums
- :
- QlikView App Dev
- :
- graph error
Options
- Subscribe to RSS Feed
- Mark Topic as New
- Mark Topic as Read
- Float this Topic for Current User
- Bookmark
- Subscribe
- Mute
- Printer Friendly Page
Turn on suggestions
Auto-suggest helps you quickly narrow down your search results by suggesting possible matches as you type.
Showing results for
Creator III
2016-09-16
10:56 AM
- Mark as New
- Bookmark
- Subscribe
- Mute
- Subscribe to RSS Feed
- Permalink
- Report Inappropriate Content
graph error
Hello community,
I have a date field in my database that containes date and time as you can see bellow :
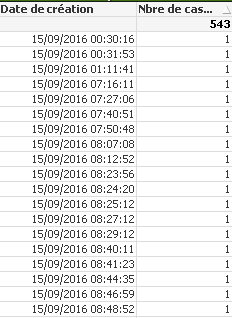
I would like to create a graph using that date but the problem as you can see bellow is that the same date is reapeated many times

Any idea please??
Thanks
510 Views
1 Solution
Accepted Solutions
MVP
2016-09-16
10:58 AM
- Mark as New
- Bookmark
- Subscribe
- Mute
- Subscribe to RSS Feed
- Permalink
- Report Inappropriate Content
479 Views
3 Replies
MVP
2016-09-16
10:58 AM
- Mark as New
- Bookmark
- Subscribe
- Mute
- Subscribe to RSS Feed
- Permalink
- Report Inappropriate Content
May be use this as your dimension:
Date(Floor([Date de creation]))
480 Views
MVP
2016-09-16
10:59 AM
- Mark as New
- Bookmark
- Subscribe
- Mute
- Subscribe to RSS Feed
- Permalink
- Report Inappropriate Content
Alternatively you can also create a only date field in the script:
LOAD Date(Floor([Date de creation])) as DateField,
[Date de creation]
FROM ....
and then use DateField as your dimension
479 Views
Creator III
2016-09-16
11:42 AM
Author
- Mark as New
- Bookmark
- Subscribe
- Mute
- Subscribe to RSS Feed
- Permalink
- Report Inappropriate Content
Thanks Sunny.
479 Views