Unlock a world of possibilities! Login now and discover the exclusive benefits awaiting you.
- Qlik Community
- :
- All Forums
- :
- QlikView App Dev
- :
- how to include a average column in simple chart
- Subscribe to RSS Feed
- Mark Topic as New
- Mark Topic as Read
- Float this Topic for Current User
- Bookmark
- Subscribe
- Mute
- Printer Friendly Page
- Mark as New
- Bookmark
- Subscribe
- Mute
- Subscribe to RSS Feed
- Permalink
- Report Inappropriate Content
how to include a average column in simple chart
Hi!
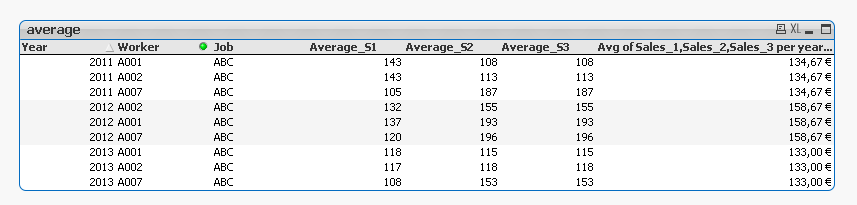
I need to add a new field in "average" chart (see the attached file) to calculate the avearge sales (sale_1, sale_2, sale_3) per year and job. I know that in excel it can be done with SUMIFS and COUNTIFS functions
I need this new field to calculate the percentage sales difference from the average sales
Regards
- Tags:
- new_to_qlikview
- « Previous Replies
-
- 1
- 2
- Next Replies »
Accepted Solutions
- Mark as New
- Bookmark
- Subscribe
- Mute
- Subscribe to RSS Feed
- Permalink
- Report Inappropriate Content
hola,
La Buscas Expresión de Que es:
AGGR(NODISTINCT Avg(Sales_1),Job,Year) )
- Mark as New
- Bookmark
- Subscribe
- Mute
- Subscribe to RSS Feed
- Permalink
- Report Inappropriate Content
sum( total <Year,Job> Sales_1+Sales_2+Sales_3) / 3
- Mark as New
- Bookmark
- Subscribe
- Mute
- Subscribe to RSS Feed
- Permalink
- Report Inappropriate Content
First, you have to add new field in the script layout , something unique. For example : Worker&Job&Year as Key1.
Next you can create three different rows which will be equal on something like that: sum(Sales_1)/Count(DISTINCT Key1);
sum(Sales_2)/Count(DISTINCT Key1);
sum(Sales_3)/Count(DISTINCT Key1);
And you’ll have all averages values for each type of Sales;
Regards,
Venelin
- Mark as New
- Bookmark
- Subscribe
- Mute
- Subscribe to RSS Feed
- Permalink
- Report Inappropriate Content
Hi Venelin!
Thanks for your reply
I have follow your instruccions and put a new expresion in the chart (New) but i have the same value that in Average_S1,
I have attached the file so please correct me if i have something wrong.
In my response to Jonathan you can see (in excel table) the values that i'm looking for
Regards
- Mark as New
- Bookmark
- Subscribe
- Mute
- Subscribe to RSS Feed
- Permalink
- Report Inappropriate Content
Hi Jonathan!
Thanks for your reply
May be i have not expressed well, but i'm not looking for the cumulative average of three sales. the resul thal i'm looking for is somethin like that(i have done in excel)
Regards
| Worker | Year | Job | Sales_1 | Sales_2 | Sales_3 | avg_sale_1 | avg_sale_2 | avg_sale_3 | % deviation Sales_1 | % deviation Sales_2 | % deviation Sales_3 |
| A001 | 2011 | ABC | 143 | 108 | 153 | 130,33 | 136,00 | 176,00 | 9,72% | -25,93% | -15,03% |
| A002 | 2011 | ABC | 143 | 113 | 196 | 130,33 | 136,00 | 176,00 | 9,72% | -20,35% | 10,20% |
| A003 | 2011 | DEF | 140 | 189 | 110 | 132,50 | 167,75 | 152,50 | 5,66% | 11,24% | -38,64% |
| A004 | 2011 | DEF | 139 | 105 | 191 | 132,50 | 167,75 | 152,50 | 4,91% | -59,76% | 20,16% |
| A005 | 2011 | GHI | 105 | 109 | 170 | 119,67 | 111,67 | 166,67 | -12,26% | -2,45% | 1,96% |
| A006 | 2011 | GHI | 126 | 117 | 149 | 119,67 | 111,67 | 166,67 | 5,29% | 4,56% | -11,86% |
| A007 | 2011 | ABC | 105 | 187 | 179 | 130,33 | 136,00 | 176,00 | -19,44% | 27,27% | 1,68% |
| A008 | 2011 | GHI | 128 | 109 | 181 | 119,67 | 111,67 | 166,67 | 6,96% | -2,45% | 7,92% |
| A009 | 2011 | DEF | 141 | 196 | 123 | 132,50 | 167,75 | 152,50 | 6,42% | 14,41% | -23,98% |
| A010 | 2011 | DEF | 110 | 181 | 186 | 132,50 | 167,75 | 152,50 | -16,98% | 7,32% | 18,01% |
| A001 | 2012 | ABC | 137 | 193 | 146 | 129,67 | 181,33 | 157,33 | 5,66% | 6,04% | -7,76% |
| A002 | 2012 | ABC | 132 | 155 | 141 | 129,67 | 181,33 | 157,33 | 1,80% | -16,99% | -11,58% |
| A003 | 2012 | DEF | 100 | 176 | 199 | 127,75 | 163,75 | 140,75 | -21,72% | 6,96% | 29,27% |
| A004 | 2012 | DEF | 136 | 154 | 121 | 127,75 | 163,75 | 140,75 | 6,46% | -6,33% | -16,32% |
| A005 | 2012 | GHI | 100 | 155 | 196 | 116,67 | 134,00 | 165,00 | -14,29% | 13,55% | 15,82% |
| A006 | 2012 | GHI | 127 | 147 | 167 | 116,67 | 134,00 | 165,00 | 8,86% | 8,84% | 1,20% |
| A007 | 2012 | ABC | 120 | 196 | 185 | 129,67 | 181,33 | 157,33 | -7,46% | 7,48% | 14,95% |
| A008 | 2012 | GHI | 123 | 100 | 132 | 116,67 | 134,00 | 165,00 | 5,43% | -34,00% | -25,00% |
| A009 | 2012 | DEF | 133 | 156 | 102 | 127,75 | 163,75 | 140,75 | 4,11% | -4,97% | -37,99% |
| A010 | 2012 | DEF | 142 | 169 | 141 | 127,75 | 163,75 | 140,75 | 11,15% | 3,11% | 0,18% |
| A001 | 2013 | ABC | 118 | 115 | 166 | 114,33 | 128,67 | 150,33 | 3,21% | -11,88% | 9,44% |
| A002 | 2013 | ABC | 117 | 118 | 155 | 114,33 | 128,67 | 150,33 | 2,33% | -9,04% | 3,01% |
| A003 | 2013 | DEF | 136 | 143 | 109 | 123,50 | 168,75 | 133,50 | 10,12% | -18,01% | -22,48% |
| A004 | 2013 | DEF | 122 | 188 | 110 | 123,50 | 168,75 | 133,50 | -1,21% | 10,24% | -21,36% |
| A005 | 2013 | GHI | 123 | 141 | 112 | 117,33 | 144,67 | 150,00 | 4,83% | -2,60% | -33,93% |
| A006 | 2013 | GHI | 112 | 114 | 158 | 117,33 | 144,67 | 150,00 | -4,55% | -26,90% | 5,06% |
| A007 | 2013 | ABC | 108 | 153 | 130 | 114,33 | 128,67 | 150,33 | -5,54% | 15,90% | -15,64% |
| A008 | 2013 | GHI | 117 | 179 | 180 | 117,33 | 144,67 | 150,00 | -0,28% | 19,18% | 16,67% |
| A009 | 2013 | DEF | 107 | 197 | 192 | 123,50 | 168,75 | 133,50 | -13,36% | 14,34% | 30,47% |
| A010 | 2013 | DEF | 129 | 147 | 123 | 123,50 | 168,75 | 133,50 | 4,45% | -14,80% | -8,54% |
- Mark as New
- Bookmark
- Subscribe
- Mute
- Subscribe to RSS Feed
- Permalink
- Report Inappropriate Content
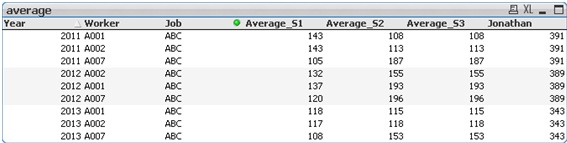
Does this work for the 3 different average calcs ?
sum( total <Year,Job> Sales_1) / count( distinct Year&Job)
sum( total <Year,Job> Sales_2) / count( distinct Year&Job)
sum( total <Year,Job> Sales_3) / count( distinct Year&Job)
- Mark as New
- Bookmark
- Subscribe
- Mute
- Subscribe to RSS Feed
- Permalink
- Report Inappropriate Content
Hi!
No, it doesn't
with your expresion i have (Jonathan field). This value not match with my excel table.
Regards
- Mark as New
- Bookmark
- Subscribe
- Mute
- Subscribe to RSS Feed
- Permalink
- Report Inappropriate Content
hola,
La Buscas Expresión de Que es:
AGGR(NODISTINCT Avg(Sales_1),Job,Year) )
- Mark as New
- Bookmark
- Subscribe
- Mute
- Subscribe to RSS Feed
- Permalink
- Report Inappropriate Content
Ok. Can you share the actual excel file ? The QVW seems like it has less data ...only has 1 row for each Year/Worker/Job combination so i couldn't test if the average is working.
- Mark as New
- Bookmark
- Subscribe
- Mute
- Subscribe to RSS Feed
- Permalink
- Report Inappropriate Content
Hola Gerardo!!
Muchas gracias por tu respuesta. Funciona perfectamete.
Saludos.
- « Previous Replies
-
- 1
- 2
- Next Replies »