Unlock a world of possibilities! Login now and discover the exclusive benefits awaiting you.

- Qlik Community
- :
- All Forums
- :
- QlikView
- :
- Calculating % Change in Straight Table
- Subscribe to RSS Feed
- Mark Topic as New
- Mark Topic as Read
- Float this Topic for Current User
- Bookmark
- Subscribe
- Mute
- Printer Friendly Page

- Mark as New
- Bookmark
- Subscribe
- Mute
- Subscribe to RSS Feed
- Permalink
- Report Inappropriate Content
Calculating % Change in Straight Table
Hello,
New to QlikView here and really sorry for asking such a basic question but could someone please explain how to calculate a percentage change in a straight table?
Say I have a straight table that has 2 columns currently, Period and Value and looks like this:
| Period | Value |
| Jan-15 | 100 |
| Feb-15 | 93 |
| Mar-15 | 88 |
| Apr-15 | 81 |
| May-15 | 76 |
| Jun-15 | 70 |
I would like to add a third column that simply calculates the percentage change
| Period | Value | % Change |
| Jan-15 | 100 | |
| Feb-15 | 93 | -7.00% |
| Mar-15 | 88 | -5.38% |
| Apr-15 | 81 | -7.95% |
| May-15 | 76 | -6.17% |
| Jun-15 | 70 | -7.89% |
My data set is obviously much larger and complex than this in actuality so I'd rather not calculate this in the load script, or do it in a pivot table. I've been trying to use a set analysis expression to no avail. Any help is appreciated!
Accepted Solutions
- Mark as New
- Bookmark
- Subscribe
- Mute
- Subscribe to RSS Feed
- Permalink
- Report Inappropriate Content
Got it! Just read about the "Above" function. So in the example I presented the expression would be entered as Above(Sum(Value))/Sum(Value)
- Mark as New
- Bookmark
- Subscribe
- Mute
- Subscribe to RSS Feed
- Permalink
- Report Inappropriate Content
Got it! Just read about the "Above" function. So in the example I presented the expression would be entered as Above(Sum(Value))/Sum(Value)
- Mark as New
- Bookmark
- Subscribe
- Mute
- Subscribe to RSS Feed
- Permalink
- Report Inappropriate Content
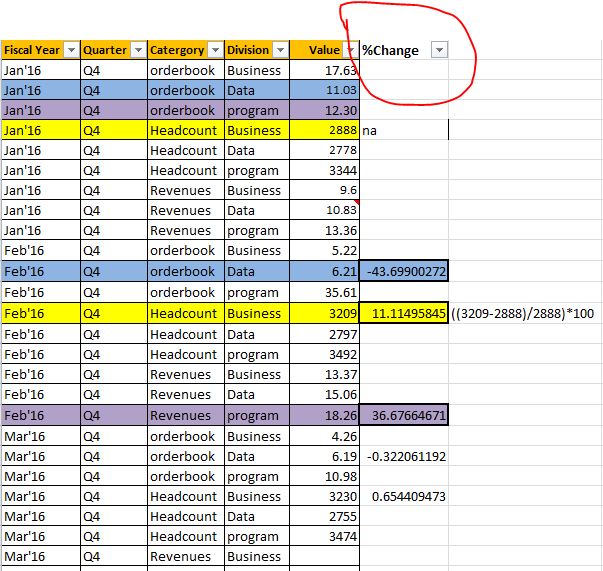
I have a similar requirement but just the 2 additional dimensions coming in, how to do it in this case?