Unlock a world of possibilities! Login now and discover the exclusive benefits awaiting you.
- Qlik Community
- :
- All Forums
- :
- QlikView
- :
- Create a pie chart
- Subscribe to RSS Feed
- Mark Topic as New
- Mark Topic as Read
- Float this Topic for Current User
- Bookmark
- Subscribe
- Mute
- Printer Friendly Page
- Mark as New
- Bookmark
- Subscribe
- Mute
- Subscribe to RSS Feed
- Permalink
- Report Inappropriate Content
Create a pie chart
I have never worked with using pie charts before and I can't seem to find a lot of information about them. Can someone point me in the right direction on finding some information????
I want to create a pie chart that uses a field that contains a value for number of days purchased in advanced. The field is called Advance Ticketing. I have another field that contains number of tickets issued; call this Tickets Issued.
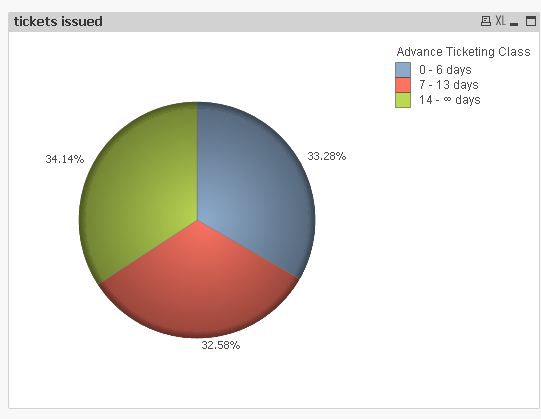
I want the pie chart to reflect the following:
0 - 6 days
7 - 13 days
14+ days
So each of these would have a percentage of how many tickets were issued for each category.
What I'm not sure of is how to set the dimension to reflect the three different categories I want to report on?????
Do I use the dimension limits in some way to set these categories up????
- « Previous Replies
-
- 1
- 2
- Next Replies »
Accepted Solutions
- Mark as New
- Bookmark
- Subscribe
- Mute
- Subscribe to RSS Feed
- Permalink
- Report Inappropriate Content
Create a calculated dimension:
=if( AdvancedPurchasedField < 7, dual( '0 - 6 days', 6),
if( AdvancedPurchasedField < 14, dual( '7 - 13 days', 13), dual('14+ days', 14)
)
)
and as expression:
=sum(TicketsIssuedField)
You can also enable relative option on expression tab.
- Mark as New
- Bookmark
- Subscribe
- Mute
- Subscribe to RSS Feed
- Permalink
- Report Inappropriate Content
Hi,
another solution could be to precalculate the buckets (depending on your table size this might improve your application performance):

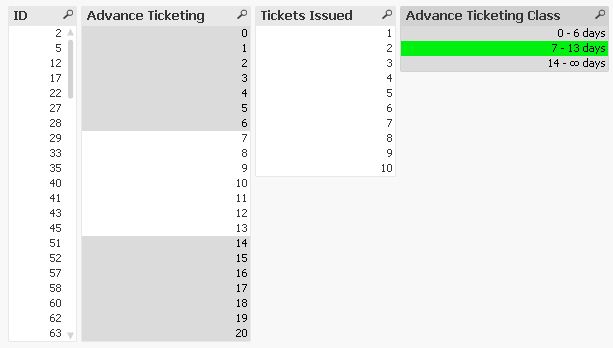
tabTickets:
LOAD RecNo() as ID,
    Floor(Rand()*21) as [Advance Ticketing],
    Ceil(Rand()*10) as [Tickets Issued]
AutoGenerate 100;

tabAdvTickClass:
LOAD *, AutoNumberHash128(RangeMin, RangeMax) as %ClassID;
LOAD RangeMin, Alt(Peek(RangeMin)-1, Dual('∞', 100000000000000)) as RangeMax
Inline [
RangeMin
14
7
0
];

tabIntMat:
IntervalMatch ([Advance Ticketing])
LOAD RangeMin, RangeMax
Resident tabAdvTickClass;

Left Join (tabTickets)
LOAD [Advance Ticketing],
    Dual(RangeMin&' - '&RangeMax&' days', RangeMin) as [Advance Ticketing Class],
    AutoNumberHash128(RangeMin, RangeMax) as %ClassID
Resident tabIntMat;

DROP Tables tabIntMat;
hope this helps
regards
Marco
- Mark as New
- Bookmark
- Subscribe
- Mute
- Subscribe to RSS Feed
- Permalink
- Report Inappropriate Content
understand the calculated dimension but not sure about the expression.
I would want the percentage of each category to be divided by the total tickets issued.
for example:
let's say the total number of advanced for 0 - 6 has 20 tickets and the total issued altogether is 170 so 0 -6 would show 12%, 7-13 has 50 tickets so it would be 50/170 for 29%, etc.
so the expression would have to be the sum of the category / sum(ticketsissuedfield)
how would that expression look????
- Mark as New
- Bookmark
- Subscribe
- Mute
- Subscribe to RSS Feed
- Permalink
- Report Inappropriate Content
=sum(ticketsissuedfield) / sum(total ticketsissuedfield)
The TOTAL qualifier should do the magic of summing all tickets across dimensions.
- Mark as New
- Bookmark
- Subscribe
- Mute
- Subscribe to RSS Feed
- Permalink
- Report Inappropriate Content
I get a 100% for each category if I do that
- Mark as New
- Bookmark
- Subscribe
- Mute
- Subscribe to RSS Feed
- Permalink
- Report Inappropriate Content
Does
=sum(ticketsissuedfield)
correctly return the ticket number for each bucket?
- Mark as New
- Bookmark
- Subscribe
- Mute
- Subscribe to RSS Feed
- Permalink
- Report Inappropriate Content
if I do sum(ticketissuedfield) i get 20,300%, 26,900%, & 19,300%
- Mark as New
- Bookmark
- Subscribe
- Mute
- Subscribe to RSS Feed
- Permalink
- Report Inappropriate Content
did you try setting the expression to "relative":
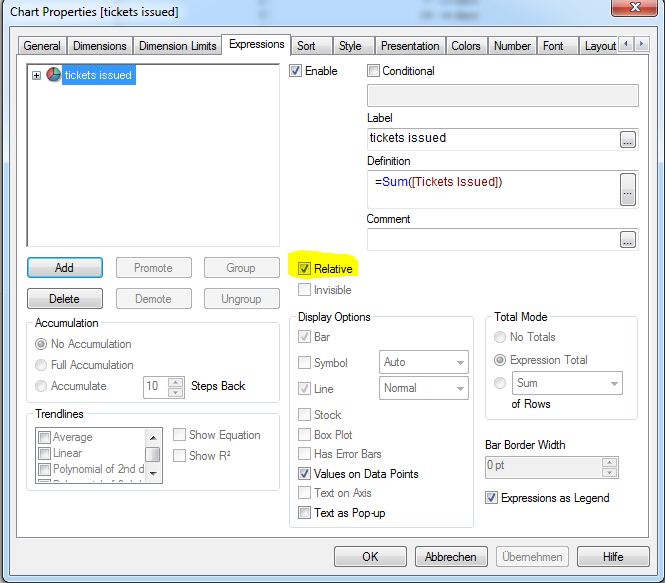
hope this helps
regards
Marco
- Mark as New
- Bookmark
- Subscribe
- Mute
- Subscribe to RSS Feed
- Permalink
- Report Inappropriate Content
yes, that's what I was missing.
thanks
- « Previous Replies
-
- 1
- 2
- Next Replies »