Unlock a world of possibilities! Login now and discover the exclusive benefits awaiting you.

- Qlik Community
- :
- All Forums
- :
- QlikView
- :
- Display the Percentage in the Bar Chart
- Subscribe to RSS Feed
- Mark Topic as New
- Mark Topic as Read
- Float this Topic for Current User
- Bookmark
- Subscribe
- Mute
- Printer Friendly Page

- Mark as New
- Bookmark
- Subscribe
- Mute
- Subscribe to RSS Feed
- Permalink
- Report Inappropriate Content
Display the Percentage in the Bar Chart
Hi
It would be greatful, if some one could help with my requirement.
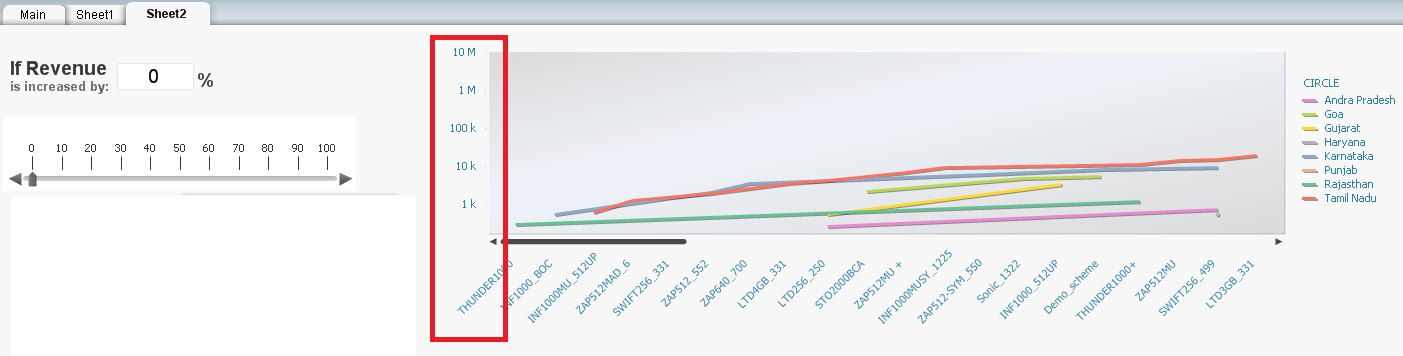
Below is the report which i am working on.
I want to display the Percentage(0, 50% and 100%) instead of 1K, 10K,....10M.
If i increase the slider 20, my values in the chart should increase the revenue by 20% and display the value accordingly.
I have used the expression: Sum([AVERAGE AMOUNT] * (1 + (vModifier / 100))) for the chart.
Dimensions - SCHEME & CIRCLE
Expression - REVENUE
AVERAGE AMOUNT is the Revenue
vModifier - variable.
How do i achieve this?
Thank You in advance.
- « Previous Replies
-
- 1
- 2
- Next Replies »

 jonathandienst
- Mark as New
- Bookmark
- Subscribe
- Mute
- Subscribe to RSS Feed
- Permalink
- Report Inappropriate Content
Hi
To get a % scale, I think you need this as the expression:
Sum([AVERAGE AMOUNT] * (1 + (vModifier / 100))) / Sum(Total <Circle> [AVERAGE AMOUNT])
And change the format in the chart properties | Numbers tab to %.
Hope that helps
Jonathan
- Mark as New
- Bookmark
- Subscribe
- Mute
- Subscribe to RSS Feed
- Permalink
- Report Inappropriate Content
Jonathan
I tried the solution which you provided:
Sum([AVERAGE AMOUNT] * (1 + (vModifier / 100))) / Sum(Total <Circle> [AVERAGE AMOUNT])
Sum([AVERAGE AMOUNT] * (1 + (vModifier / 100))) / Sum(Total <CIRCLE> [AVERAGE AMOUNT])
In my report CIRCLE is a Dimension.
When using <CIRCLE> (Dimension), the below report is displayed.
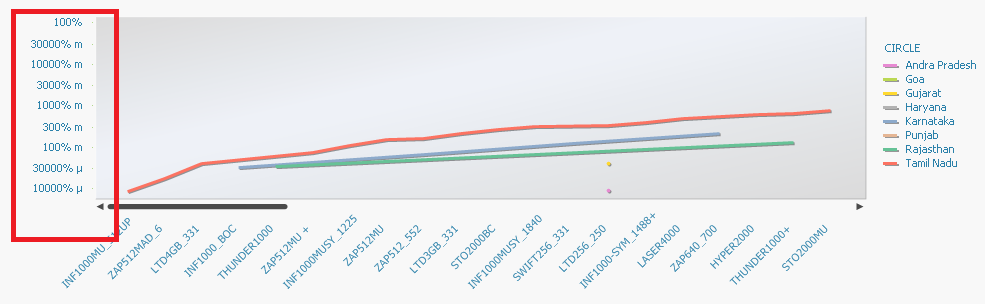
When using <Circle>, the below report is displayed.
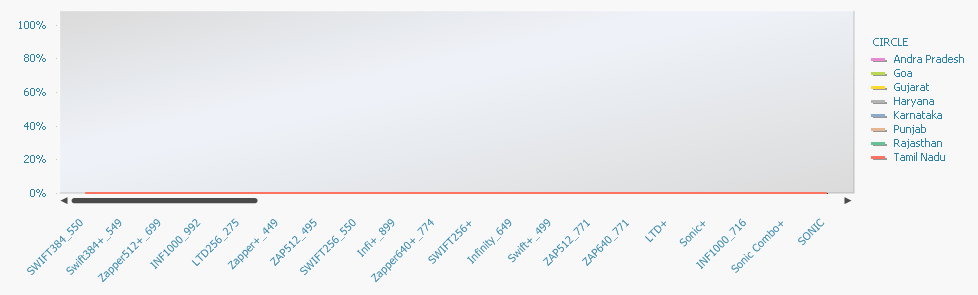
Can you guide me where am i going wrong?
Thank You.
jonathandienst
- Mark as New
- Bookmark
- Subscribe
- Mute
- Subscribe to RSS Feed
- Permalink
- Report Inappropriate Content
Hi
Please post a sample of your app. I need to look at the data to understand your chart.
I think the field should have been CIRCLE. Circle was a typo imy expression. To see what is actually on the axis, turn off the percent format on the axis.
Regards
Jonathan
- Mark as New
- Bookmark
- Subscribe
- Mute
- Subscribe to RSS Feed
- Permalink
- Report Inappropriate Content
Jonathan,
As i am using QV 11 Personal Edition. No one can open the qvw file which i have developed. Anyway i have attached for your reference. Do try to open.
If cant open the file please do revert back.
If i try to remove the Percentage in Chart Properties ---- Number(Fixed To), i am getting the below result in the Y Axis.
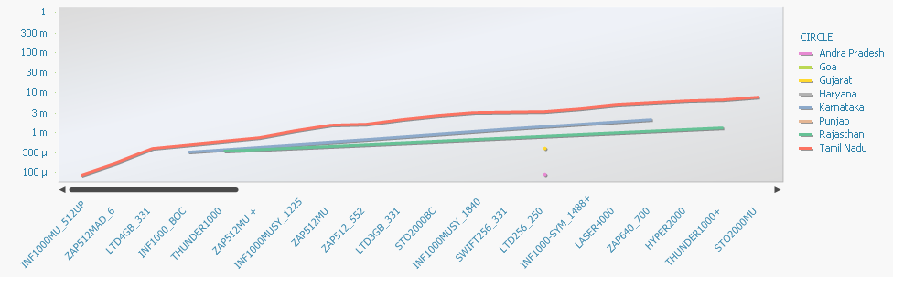
Thank You.
jonathandienst
- Mark as New
- Bookmark
- Subscribe
- Mute
- Subscribe to RSS Feed
- Permalink
- Report Inappropriate Content
Vinod
Anyone with a license can read the file your created - its only other PE users that cannot open the file. I will have a look
Regards
Jonathan
jonathandienst
- Mark as New
- Bookmark
- Subscribe
- Mute
- Subscribe to RSS Feed
- Permalink
- Report Inappropriate Content
Vinod
Not sure if you are able to open the attachment. All I did was recreate the chart - it seems your one somehow got corrupted. The new chart behaves as I would expect. For some reason the image feature is not working so I have attached the picture as well.
Regards
Jonathan

- Mark as New
- Bookmark
- Subscribe
- Mute
- Subscribe to RSS Feed
- Permalink
- Report Inappropriate Content
Jonathan,
You are rite. The attached qvw file is not opening for me.
The picture which you have attached is the result which i need to get.
The expression matches with my report and with your picture.
I am not sure where i have gone wrong.
Please do check with this also,
In Chart Properties - Number
I have selected Integer and checked the show in Percent(%)
Have done anything wrong in this chart Property(Number)?
Thank You.
jonathandienst
- Mark as New
- Bookmark
- Subscribe
- Mute
- Subscribe to RSS Feed
- Permalink
- Report Inappropriate Content
Vinod
Delete the chart and start again. The one in the file you posted is corrupted so you will not get that one to work properly. That's what I did to get the chart picture that I posted
Regards
Jonathan
- Mark as New
- Bookmark
- Subscribe
- Mute
- Subscribe to RSS Feed
- Permalink
- Report Inappropriate Content
Sure Jonathan, will give it a try.
- « Previous Replies
-
- 1
- 2
- Next Replies »