Unlock a world of possibilities! Login now and discover the exclusive benefits awaiting you.

- Qlik Community
- :
- All Forums
- :
- QlikView
- :
- Need help with a pie chart
- Subscribe to RSS Feed
- Mark Topic as New
- Mark Topic as Read
- Float this Topic for Current User
- Bookmark
- Subscribe
- Mute
- Printer Friendly Page

- Mark as New
- Bookmark
- Subscribe
- Mute
- Subscribe to RSS Feed
- Permalink
- Report Inappropriate Content
Need help with a pie chart
Hello community,
Im kinda new to qlikview only been using it for about 2-3 weeks
and now im in trouble with a pie chart,
I got this table to show what im trying to graphs
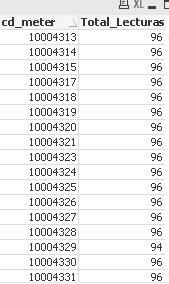
theeres a meter_id "cd_meter" and the total amount of reading done "total_lecturas"
the reading are supposed to be each 15 mim so theres 96 reading in a day, but something for errors they dont ocurred
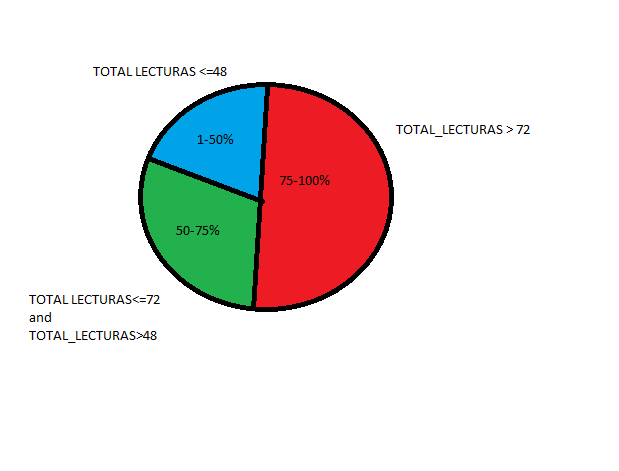
so i'm trying to graphs in a pie chart how many meters got arround 75-100% of the readings, 50-75%, and less than 50%
in diffrent colours, like this (ignore paint)
how I alredy do the count(readings) in the script and save it like total_lecturas in the expresion of the pie chart
I have =total_lecturas, and im using the color mixed wizard to give the color for each porcent
something like this, ignore the colors, if(total_lecturas>72, rgb(123,123,4123), if(total_lecturas<=72 and total_lecturas>48,rgb(2312,412, etc etc)
Accepted Solutions

 jaumecf23
- Mark as New
- Bookmark
- Subscribe
- Mute
- Subscribe to RSS Feed
- Permalink
- Report Inappropriate Content
This is the code that i have use :
Intervals:
LOAD * Inline [
from, to, %
"0", "48", "< 50%"
"49", "72", "50-75%"
"73", "96", ">75%"
];
Temporal:
LOAD * INLINE [
cd_meter, Lecturas
1, 96
2, 96
3, 20
4, 70
5, 50
6, 10
7, 20
8, 52
];
IntervalMatch(Lecturas)
left Join(Temporal)
LOAD Distinct from, to
RESIDENT Intervals;
Left join (Temporal)
LOAD * resident Intervals;
DROP Fields from, to;
DROP Tables Intervals;
Then I have created the objtect using the Dimension "%" and the Expression "count(cd_meter)"
jaumecf23
- Mark as New
- Bookmark
- Subscribe
- Mute
- Subscribe to RSS Feed
- Permalink
- Report Inappropriate Content
I attach a QVW than can provides a solution
- Mark as New
- Bookmark
- Subscribe
- Mute
- Subscribe to RSS Feed
- Permalink
- Report Inappropriate Content
jaumecf23
- Mark as New
- Bookmark
- Subscribe
- Mute
- Subscribe to RSS Feed
- Permalink
- Report Inappropriate Content
This is the code that i have use :
Intervals:
LOAD * Inline [
from, to, %
"0", "48", "< 50%"
"49", "72", "50-75%"
"73", "96", ">75%"
];
Temporal:
LOAD * INLINE [
cd_meter, Lecturas
1, 96
2, 96
3, 20
4, 70
5, 50
6, 10
7, 20
8, 52
];
IntervalMatch(Lecturas)
left Join(Temporal)
LOAD Distinct from, to
RESIDENT Intervals;
Left join (Temporal)
LOAD * resident Intervals;
DROP Fields from, to;
DROP Tables Intervals;
Then I have created the objtect using the Dimension "%" and the Expression "count(cd_meter)"