Unlock a world of possibilities! Login now and discover the exclusive benefits awaiting you.

- Qlik Community
- :
- All Forums
- :
- QlikView
- :
- Pivot Table
- Subscribe to RSS Feed
- Mark Topic as New
- Mark Topic as Read
- Float this Topic for Current User
- Bookmark
- Subscribe
- Mute
- Printer Friendly Page

- Mark as New
- Bookmark
- Subscribe
- Mute
- Subscribe to RSS Feed
- Permalink
- Report Inappropriate Content
Pivot Table
Hi All,
Can anyone help me with this?
My data is in the attached spreadsheet. I need to create a pivot table that more or less looks like the chart below.
The column 'Annual Turns' represents the buckets (<0, 0-0.25)
The column 'Amount' represents the values in the pivot table.

So for distributor A, we should get :
<0: $540
0-0.25: $4322
0.25-0.5: $56962
0.5-0.75: $0
0.75-1: $0
>1: $3947344
Accepted Solutions

 devarasu07
- Mark as New
- Bookmark
- Subscribe
- Mute
- Subscribe to RSS Feed
- Permalink
- Report Inappropriate Content
Hi,
you can try to create logical amount age bucket like below,
Fact:
load *,
if( [Annual Turn] <=0,Dual('<0',1),
if( [Annual Turn] >0 and [Annual Turn] <=0.25,Dual('<0-0.25',2),
if( [Annual Turn] >0.25 and [Annual Turn] <=0.5,Dual('<0.25-0.5',3),
if( [Annual Turn] >0.5 and [Annual Turn] <=0.75,Dual('<0.5-0.75',4),
if( [Annual Turn] >0.75 and [Annual Turn] <=0.1,Dual('<0.75-0.1',5),Dual('>1',6) ))))) as AnnualTrun_AgeGroup;
LOAD Distributor,
[Part Number],
Amount,
[Annual Turn]
FROM
(ooxml, embedded labels, table is Sheet1);
Note: based on your data o/p should return below,

devarasu07
- Mark as New
- Bookmark
- Subscribe
- Mute
- Subscribe to RSS Feed
- Permalink
- Report Inappropriate Content
Hi,
you can try to create logical amount age bucket like below,
Fact:
load *,
if( [Annual Turn] <=0,Dual('<0',1),
if( [Annual Turn] >0 and [Annual Turn] <=0.25,Dual('<0-0.25',2),
if( [Annual Turn] >0.25 and [Annual Turn] <=0.5,Dual('<0.25-0.5',3),
if( [Annual Turn] >0.5 and [Annual Turn] <=0.75,Dual('<0.5-0.75',4),
if( [Annual Turn] >0.75 and [Annual Turn] <=0.1,Dual('<0.75-0.1',5),Dual('>1',6) ))))) as AnnualTrun_AgeGroup;
LOAD Distributor,
[Part Number],
Amount,
[Annual Turn]
FROM
(ooxml, embedded labels, table is Sheet1);
Note: based on your data o/p should return below,
- Mark as New
- Bookmark
- Subscribe
- Mute
- Subscribe to RSS Feed
- Permalink
- Report Inappropriate Content
Thanks for your reply! For my dashboard I have to create the age buckets as calculated dimension and it works great!
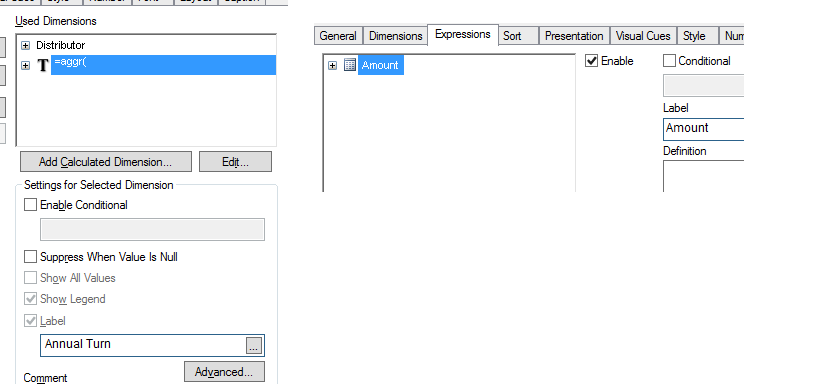
So under dimensions I have : 1) Distributor
2) Calculated dimension -Annual Turn
Expression: Amount
Do you know how I can add a total column per distributor? Thanks!

devarasu07
- Mark as New
- Bookmark
- Subscribe
- Mute
- Subscribe to RSS Feed
- Permalink
- Report Inappropriate Content
Hi,
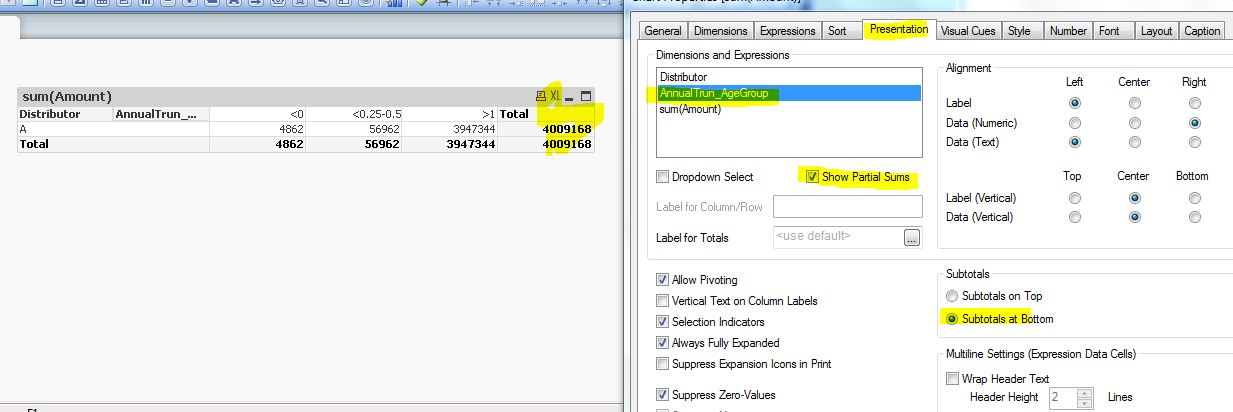
Yes we can do that. by enabling chart property presentation tab-->Partial sum on the Distributor dimension then it should return the desired output. thanks
Regards,
Deva
- Mark as New
- Bookmark
- Subscribe
- Mute
- Subscribe to RSS Feed
- Permalink
- Report Inappropriate Content
Thank you 