Unlock a world of possibilities! Login now and discover the exclusive benefits awaiting you.

Announcements
Talend Cloud AWS EU Scheduled Outage: Starting Tues 26 May 21:00 CEST with expected completion Wed 27 May 01:00 CEST
- Qlik Community
- :
- All Forums
- :
- QlikView
- :
- Qlikview 11 for developers - difference in one gau...
Options
- Subscribe to RSS Feed
- Mark Topic as New
- Mark Topic as Read
- Float this Topic for Current User
- Bookmark
- Subscribe
- Mute
- Printer Friendly Page
Turn on suggestions
Auto-suggest helps you quickly narrow down your search results by suggesting possible matches as you type.
Showing results for

Not applicable
2014-04-17
08:42 PM
- Mark as New
- Bookmark
- Subscribe
- Mute
- Subscribe to RSS Feed
- Permalink
- Report Inappropriate Content
Qlikview 11 for developers - difference in one gauge chart
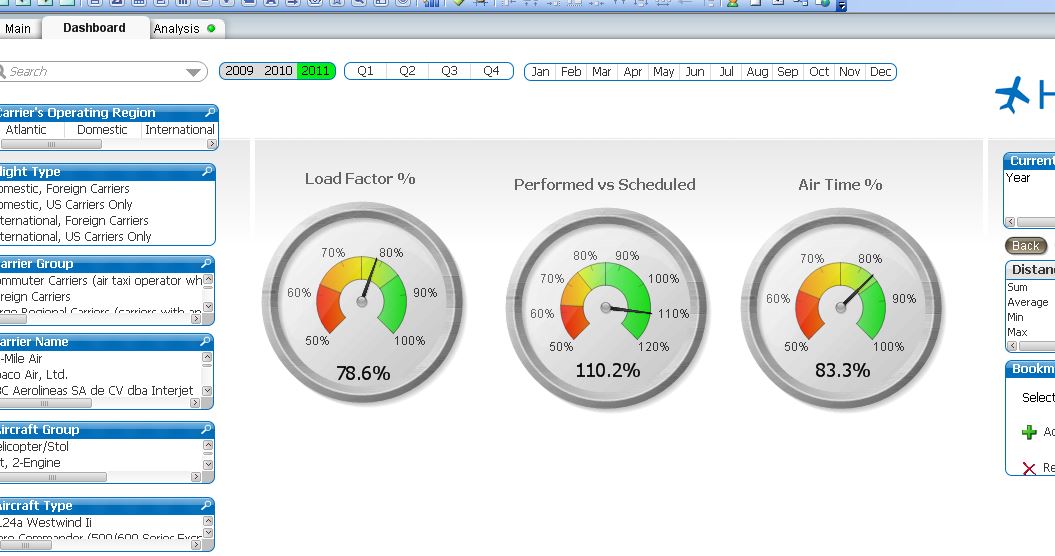
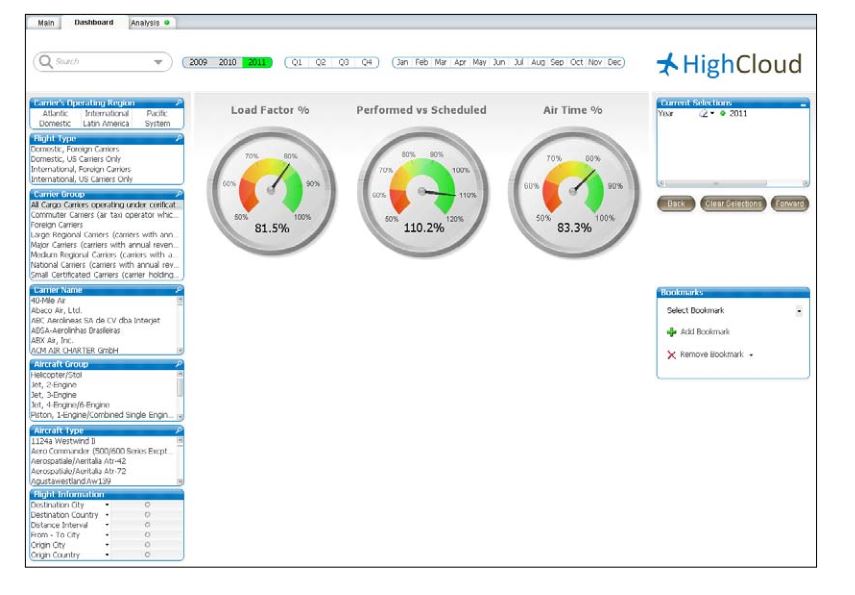
Page 176 - My Load Factor chart has a different value, but everything else is same. Why ?
QVW file attached.
My chart -
Book chart -
712 Views
2 Replies
Not applicable
2014-04-17
10:10 PM
Author
- Mark as New
- Bookmark
- Subscribe
- Mute
- Subscribe to RSS Feed
- Permalink
- Report Inappropriate Content
No Need to worry,
You done right and the answer you get correct,
Because Its a linked object, The value you get is depends upon the previous selections.
Thanks & Regards
Venu
596 Views
Not applicable
2014-04-18
01:31 AM
Author
- Mark as New
- Bookmark
- Subscribe
- Mute
- Subscribe to RSS Feed
- Permalink
- Report Inappropriate Content
You can always test the results using a text box, to check whether the data populated in the chart is correct or not against the source data.
Regards,
Swathi
596 Views