Unlock a world of possibilities! Login now and discover the exclusive benefits awaiting you.
- Qlik Community
- :
- All Forums
- :
- QlikView
- :
- Remove Zero on X- Axis Bar chart
- Subscribe to RSS Feed
- Mark Topic as New
- Mark Topic as Read
- Float this Topic for Current User
- Bookmark
- Subscribe
- Mute
- Printer Friendly Page
- Mark as New
- Bookmark
- Subscribe
- Mute
- Subscribe to RSS Feed
- Permalink
- Report Inappropriate Content
Remove Zero on X- Axis Bar chart
Hi Everyone,
I was getting 0 in the x-axis bar chart.Please help me how to remove it .It was coming because of using year to date function in dimension.
Check the attachment and also is there a way can i join both the charts in one.Expressions are same,but dimensions are different.
Thanks,
Venkat
- « Previous Replies
-
- 1
- 2
- Next Replies »
- Mark as New
- Bookmark
- Subscribe
- Mute
- Subscribe to RSS Feed
- Permalink
- Report Inappropriate Content
what is your expression ?
- Mark as New
- Bookmark
- Subscribe
- Mute
- Subscribe to RSS Feed
- Permalink
- Report Inappropriate Content
not sure whats ur calculated dimension but you write something like if(yeartodate(...)=0,'')
- Mark as New
- Bookmark
- Subscribe
- Mute
- Subscribe to RSS Feed
- Permalink
- Report Inappropriate Content
Dimension is Year2date(Date),Expression iam using dual to calculate the % and num
- Mark as New
- Bookmark
- Subscribe
- Mute
- Subscribe to RSS Feed
- Permalink
- Report Inappropriate Content
Can't you simply tick the check box "Hide Axis". Will that help?
Thanks,
Ram
- Mark as New
- Bookmark
- Subscribe
- Mute
- Subscribe to RSS Feed
- Permalink
- Report Inappropriate Content
Thanks for your reply.If i remove the legend that's working .But i need to show dimension name in X-axis.Any ideas
Thanks,
Venkat
- Mark as New
- Bookmark
- Subscribe
- Mute
- Subscribe to RSS Feed
- Permalink
- Report Inappropriate Content
If you in a hurry situation, just use a text box to hide it 
- Mark as New
- Bookmark
- Subscribe
- Mute
- Subscribe to RSS Feed
- Permalink
- Report Inappropriate Content
you must have checked the option "Text on Axis" option in the Expression tab. un-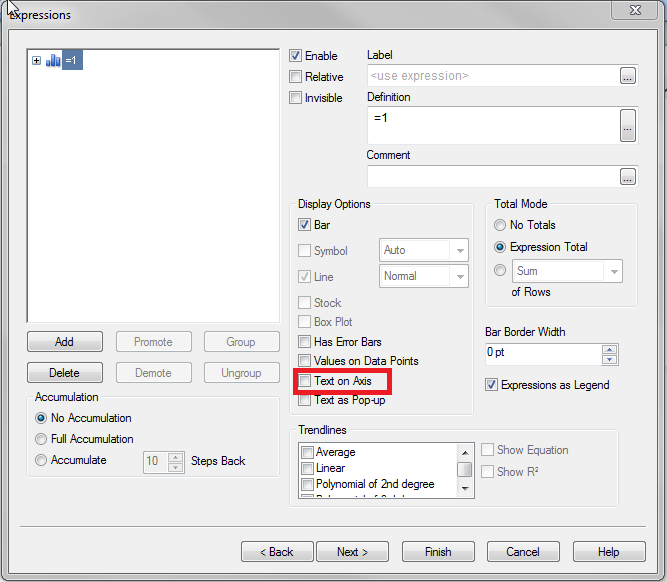 check that option.
- Mark as New
- Bookmark
- Subscribe
- Mute
- Subscribe to RSS Feed
- Permalink
- Report Inappropriate Content
Nope actually 0 is coming from calculated dimension. I had a dimension date field like 'DD/MM/YYYY'.when i use that i am getting graph as per every year but i need upto date.So, i used year2date which is causing that 0.
- Mark as New
- Bookmark
- Subscribe
- Mute
- Subscribe to RSS Feed
- Permalink
- Report Inappropriate Content
so you have two dimensions and three expressions on the bar chart. correct?
Can you please post the expression you are using in the calculated dimension.
- « Previous Replies
-
- 1
- 2
- Next Replies »