Unlock a world of possibilities! Login now and discover the exclusive benefits awaiting you.

- Qlik Community
- :
- All Forums
- :
- QlikView
- :
- Scatter Plot with Text Value as Axis
- Subscribe to RSS Feed
- Mark Topic as New
- Mark Topic as Read
- Float this Topic for Current User
- Bookmark
- Subscribe
- Mute
- Printer Friendly Page

- Mark as New
- Bookmark
- Subscribe
- Mute
- Subscribe to RSS Feed
- Permalink
- Report Inappropriate Content
Scatter Plot with Text Value as Axis
Hi all,
I would like to create a scatter plot with a dimension of product codes, and show a trend by quantity purchased and by office for which each product was purchased. The "by quantity" expression is no problem; I'm running in to issues with the "by office" expression/variable. It appears that scatter plots in QV want to take expressions with numerical values rather than text values. My offices are all text values, but I'm hoping I can find a way around this nuance so that it will show the office names.
-Paul
Accepted Solutions

 swuehl
- Mark as New
- Bookmark
- Subscribe
- Mute
- Subscribe to RSS Feed
- Permalink
- Report Inappropriate Content
Paul,
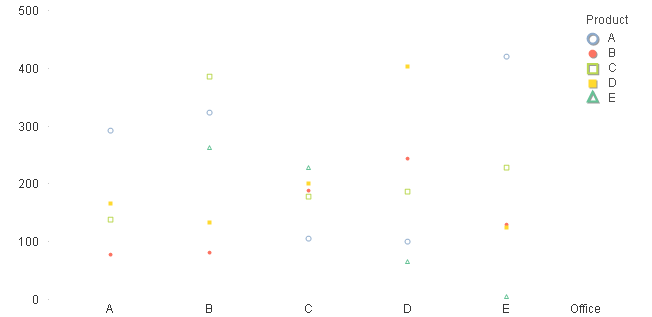
I am not quite sure what you want to show with your scatter chart, but have you tried a standard line / bar chart with two dimensions Office and Product Code and sum(Quantity) as expression? You can use symbols instead of lines / bars, if you want, so it might look like
swuehl
- Mark as New
- Bookmark
- Subscribe
- Mute
- Subscribe to RSS Feed
- Permalink
- Report Inappropriate Content
Paul,
I am not quite sure what you want to show with your scatter chart, but have you tried a standard line / bar chart with two dimensions Office and Product Code and sum(Quantity) as expression? You can use symbols instead of lines / bars, if you want, so it might look like