Unlock a world of possibilities! Login now and discover the exclusive benefits awaiting you.
Announcements
ALERT: QlikView server communication interruptions following Microsoft Windows Domain Controller security updates
- Qlik Community
- :
- All Forums
- :
- QlikView
- :
- Scatter with smooth lines and makers chart
Options
- Subscribe to RSS Feed
- Mark Topic as New
- Mark Topic as Read
- Float this Topic for Current User
- Bookmark
- Subscribe
- Mute
- Printer Friendly Page
Turn on suggestions
Auto-suggest helps you quickly narrow down your search results by suggesting possible matches as you type.
Showing results for
Not applicable
2015-10-23
03:15 PM
- Mark as New
- Bookmark
- Subscribe
- Mute
- Subscribe to RSS Feed
- Permalink
- Report Inappropriate Content
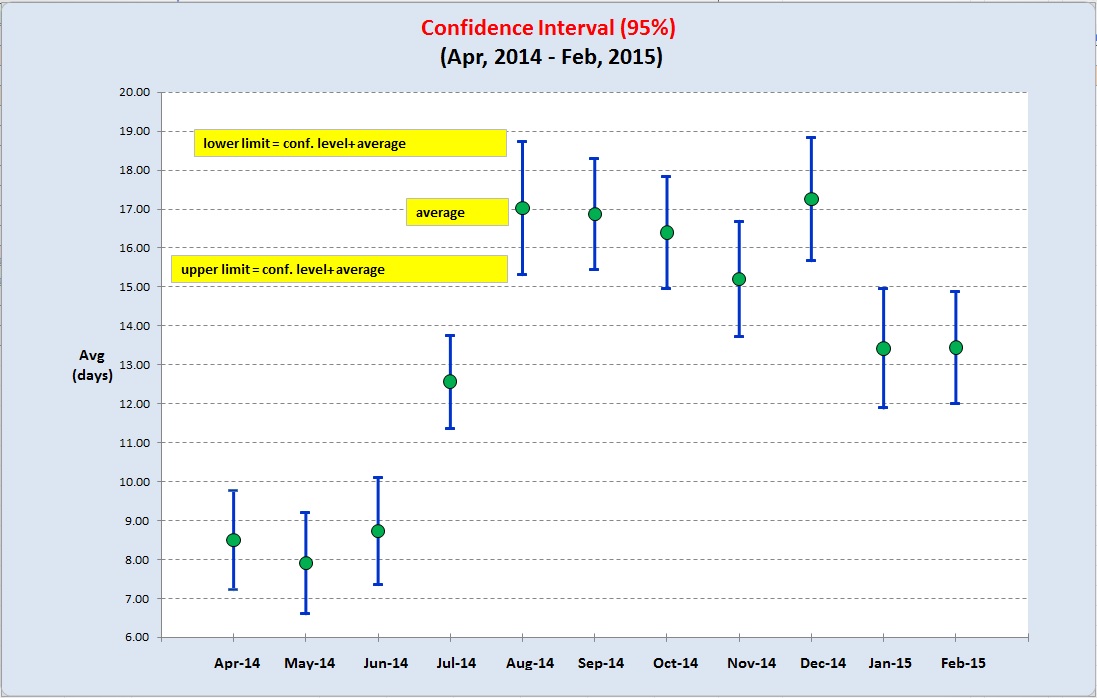
Scatter with smooth lines and makers chart
Hi,
I have already made this chart on excel which is a "scatter with smooth lines and makers" chart but, I don't know how to make it in Qlikview.
can anybody help me?
Thanks a lot.
869 Views
4 Replies
Specialist
2015-10-23
03:34 PM
- Mark as New
- Bookmark
- Subscribe
- Mute
- Subscribe to RSS Feed
- Permalink
- Report Inappropriate Content
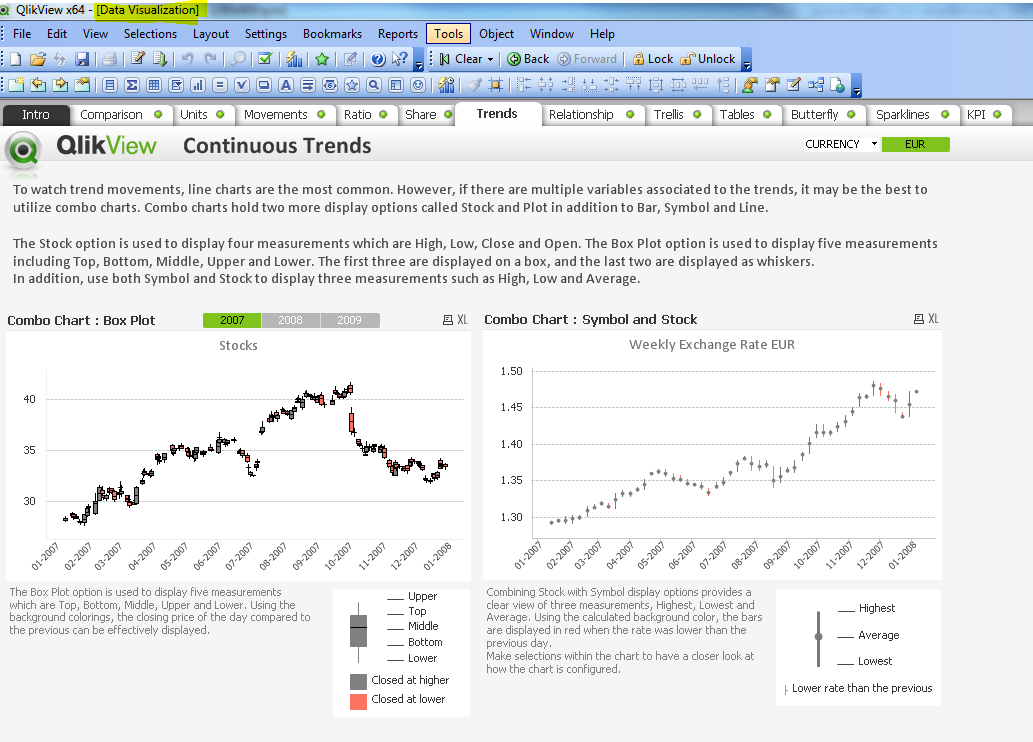
Data Visualization.qvw example dashboard, generally available at C:\Program Files\QlikView\Examples\Documents has similar charts make use of them.
771 Views
Not applicable
2015-10-23
03:38 PM
Author
- Mark as New
- Bookmark
- Subscribe
- Mute
- Subscribe to RSS Feed
- Permalink
- Report Inappropriate Content
Thanks,
I have already tried 'Box Plot' and 'Socks' but, they did not work for me.
771 Views
Support
2015-10-24
08:16 AM
- Mark as New
- Bookmark
- Subscribe
- Mute
- Subscribe to RSS Feed
- Permalink
- Report Inappropriate Content
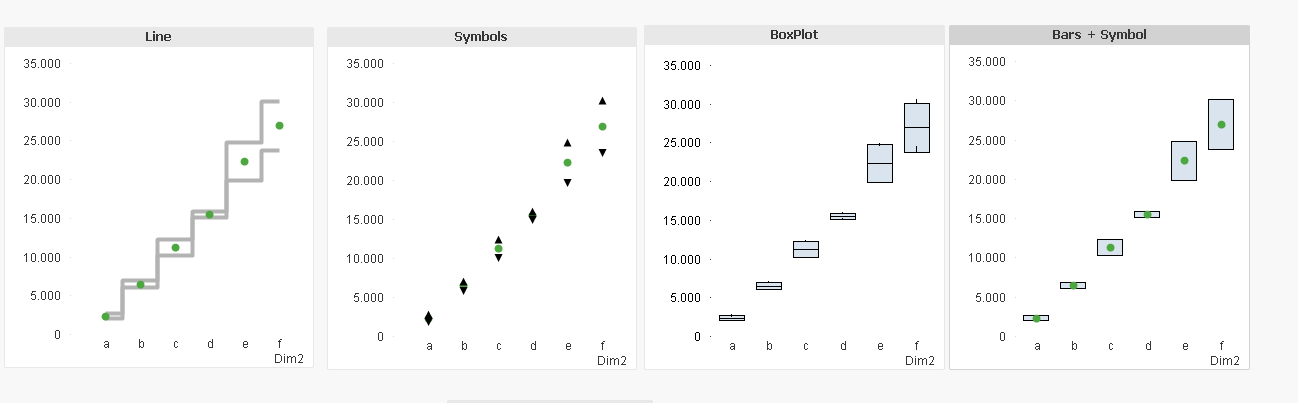
although it is not possible to get exactly the same, maybe some of these examples fit to your needs
771 Views
Support
2015-10-24
08:17 AM
- Mark as New
- Bookmark
- Subscribe
- Mute
- Subscribe to RSS Feed
- Permalink
- Report Inappropriate Content
I´ve used standard deviation, but you can use confidence, just reconfiguting the expressions