Unlock a world of possibilities! Login now and discover the exclusive benefits awaiting you.

- Qlik Community
- :
- All Forums
- :
- QlikView
- :
- linear trend line one expression two dimensions co...
- Subscribe to RSS Feed
- Mark Topic as New
- Mark Topic as Read
- Float this Topic for Current User
- Bookmark
- Subscribe
- Mute
- Printer Friendly Page

 YoussefBelloum
- Mark as New
- Bookmark
- Subscribe
- Mute
- Subscribe to RSS Feed
- Permalink
- Report Inappropriate Content
linear trend line one expression two dimensions combo chart
Hi everyone,
I have the barchart below:
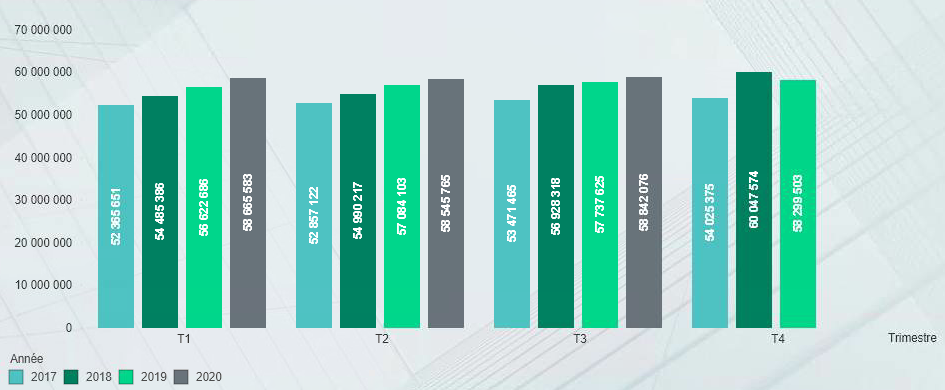
I need to add a linear trend line for the last year only, the problem is that when I use the checkbox of the linear trend line, it gives me trend lines for all the years displayed on my barchart (4 trend lines), like the image below:
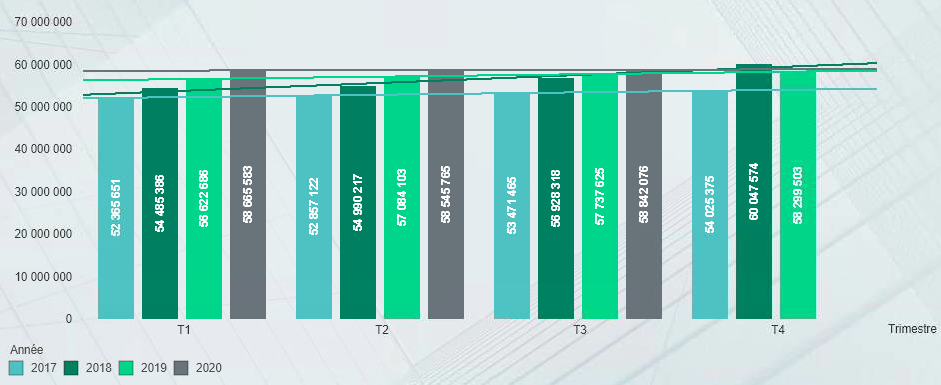
I only need one linear trend line, always for the last year (2020 in this example).
I tried to add another expression and use the linest_m and linet_b functions, but I'm struggling to make it work
I have two dimensions: Quarter and Year
One expression: Sum(X)
Thank you for your time
Youssef
Accepted Solutions

 rubenmarin
- Mark as New
- Bookmark
- Subscribe
- Mute
- Subscribe to RSS Feed
- Permalink
- Report Inappropriate Content
Hi @YoussefBelloum, I'm not sure if this can work, I did a dumb sample and seems to work.
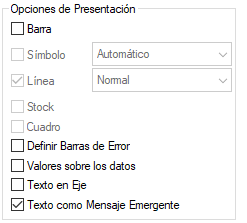
Add another expression as If(Year=Max(TOTAL Year), Sum(X)) and uncheck to show as bar and show only as popup. In this expression check the option to show the trend line.
rubenmarin
- Mark as New
- Bookmark
- Subscribe
- Mute
- Subscribe to RSS Feed
- Permalink
- Report Inappropriate Content
Hi @YoussefBelloum, I'm not sure if this can work, I did a dumb sample and seems to work.
Add another expression as If(Year=Max(TOTAL Year), Sum(X)) and uncheck to show as bar and show only as popup. In this expression check the option to show the trend line.
YoussefBelloum
- Mark as New
- Bookmark
- Subscribe
- Mute
- Subscribe to RSS Feed
- Permalink
- Report Inappropriate Content
