Unlock a world of possibilities! Login now and discover the exclusive benefits awaiting you.
- Qlik Community
- :
- All Forums
- :
- QlikView
- :
- stacked bar chart
- Subscribe to RSS Feed
- Mark Topic as New
- Mark Topic as Read
- Float this Topic for Current User
- Bookmark
- Subscribe
- Mute
- Printer Friendly Page
- Mark as New
- Bookmark
- Subscribe
- Mute
- Subscribe to RSS Feed
- Permalink
- Report Inappropriate Content
stacked bar chart
Hi
I want to create a stacked bar chart in My qv document attached herewith. I want to to have two bar chart for Actual and budget.
In the each bar chart % of items give should appear. Pls help me to do this from QV document
- « Previous Replies
-
- 1
- 2
- Next Replies »
- Mark as New
- Bookmark
- Subscribe
- Mute
- Subscribe to RSS Feed
- Permalink
- Report Inappropriate Content
Try this..
Total is now 100% because UPR has -3%
- Mark as New
- Bookmark
- Subscribe
- Mute
- Subscribe to RSS Feed
- Permalink
- Report Inappropriate Content
Thanks Manish
Slight change I do want to income to show in this chart. but how the % Income is divided among other items like
follows
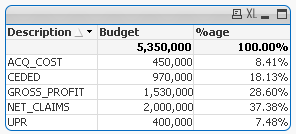
| CEDED | 970,000 | 18% |
| UPR | 400,000 | 7% |
| NET_CLAIMS | 2,000,000 | 37% |
| ACQ_COST | 450,000 | 8% |
| GROSS_PROFIT | 1,530,000 | 29% |
Pls help
- Mark as New
- Bookmark
- Subscribe
- Mute
- Subscribe to RSS Feed
- Permalink
- Report Inappropriate Content
I am not getting. Can you let me know exactly how you want to show % and what are the descriptions you are going to consider.
If possible, provide an excel with result. I will surely do my best to help you.
- Mark as New
- Bookmark
- Subscribe
- Mute
- Subscribe to RSS Feed
- Permalink
- Report Inappropriate Content
This is what I want
out of Total Income of 5,350,000
Ceded is 970,000 that is 18% of income (5350000)
UPR is 400,000 7% of income
Net Claim 2000000 37 %
....
Like wise total come to 100% .
- Mark as New
- Bookmark
- Subscribe
- Mute
- Subscribe to RSS Feed
- Permalink
- Report Inappropriate Content
Still you are not giving me full data..
.....
I will not understand what else DESCRIPTION you want to cover..
Kindly provide an excel..if possible
Also, UPR is -400,000 not 400,000. Please clarify !
- Mark as New
- Bookmark
- Subscribe
- Mute
- Subscribe to RSS Feed
- Permalink
- Report Inappropriate Content
Hi ,
If sum Budget = Total Income ( i.e, 5,350,000) for the below data
say if (970,000 + 400,000+2,000,000 + 450,000+1,530,000 = 5,350,000)
| CEDED | 970,000 | 18% |
| UPR | 400,000 | 7% |
| NET_CLAIMS | 2,000,000 | 37% |
| ACQ_COST | 450,000 | 8% |
| GROSS_PROFIT | 1,530,000 | 29% |
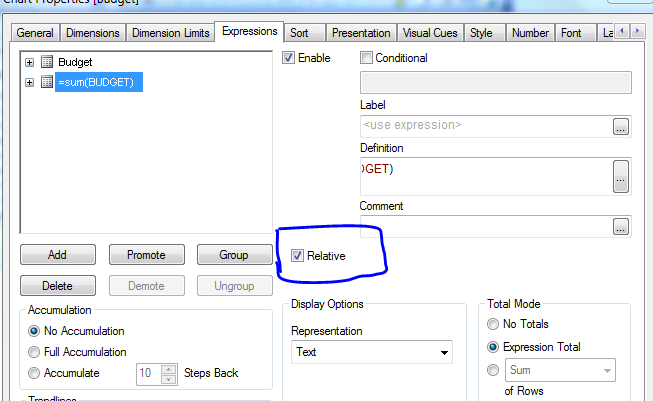
then you can add one more expression =sum(Budget) and check relative checkbox, you will get the %age
- Mark as New
- Bookmark
- Subscribe
- Mute
- Subscribe to RSS Feed
- Permalink
- Report Inappropriate Content
- Mark as New
- Bookmark
- Subscribe
- Mute
- Subscribe to RSS Feed
- Permalink
- Report Inappropriate Content
Thanks
I have attached excel sheet. What I want is to show how Income is divided among other items
- Mark as New
- Bookmark
- Subscribe
- Mute
- Subscribe to RSS Feed
- Permalink
- Report Inappropriate Content
Sorry I could not attach excel sheet
- Mark as New
- Bookmark
- Subscribe
- Mute
- Subscribe to RSS Feed
- Permalink
- Report Inappropriate Content
Still you didn't clarify between -400,000 and 400,000
- « Previous Replies
-
- 1
- 2
- Next Replies »