Unlock a world of possibilities! Login now and discover the exclusive benefits awaiting you.
Analytics & AI
Forums for Qlik Analytic solutions. Ask questions, join discussions, find solutions, and access documentation and resources.
Data Integration & Quality
Forums for Qlik Data Integration solutions. Ask questions, join discussions, find solutions, and access documentation and resources
Explore Qlik Gallery
Qlik Gallery is meant to encourage Qlikkies everywhere to share their progress – from a first Qlik app – to a favorite Qlik app – and everything in-between.
Qlik Community
Get started on Qlik Community, find How-To documents, and join general non-product related discussions.
Qlik Resources
Direct links to other resources within the Qlik ecosystem. We suggest you bookmark this page.
Qlik Academic Program
Qlik gives qualified university students, educators, and researchers free Qlik software and resources to prepare students for the data-driven workplace.
Recent Blog Posts
-
Qlik Sense Migration: Migrating your Entire Qlik Sense Environment
Hi everyone, For various and valid reasons, you might need to migrate your entire Qlik Sense environment, or part of it, somewhere else. In this post... Show MoreHi everyone,
For various and valid reasons, you might need to migrate your entire Qlik Sense environment, or part of it, somewhere else.
In this post, I’ll cover the most common scenario: a complete migration of a single or multi-node Qlik Sense system, with the bundled PostgreSQL database (Qlik Sense Repository Database service) in a new environment.
So, how do we do that?
- Introduction and preparation
- Backup your old environment
- Deploy and restore the new central environment
- What about my rim nodes?
- Finalizing your migration
- Data Connection
- Licensing
- Best practices
If direct assistance is needed and you require hands-on help with a migration, engage Qlik Consulting. Qlik Support cannot provide walk-through assistance with server migrations outside of a post-installation and migration completion break/fix scenario.
Introduction and preparation
Let’s start with a little bit of context: Say that we are running a 3 nodes Qlik Sense environment (Central node / Proxy-Engine node / Scheduler node).
On the central node, I also have the Qlik shared folder and the bundled Qlik Sense Repository Database installed.
If you have previously unbundled your PostgreSQL install, see How To migrate a Qlik Sense Enterprise on Windows environment to a different host after unbundling PostgreSQL for instructions on how to migrate.
This environment has been running well for years but I now need to move it to a brand new hardware ensuring better performance. It’s not possible to reinstall everything from scratch because the system has been heavily used and customized already. Redoing all of that to replicate the environment is too difficult and time-consuming.
I start off with going through a checklist to verify if the new system I’m migrating to is up to it:
- Do I meet the system requirements? Qlik Sense System Requirements
- Am I following virtualization best practices? Virtualization Best Practices In QlikView And Qlik Sense
And then I move right over to…
Backup your old environment
The first step to migrate your environment in this scenario is to back it up.
To do that, I would recommend following the steps documented on help.qlik.com (make sure to select your Qlik Sense version top left of the screen).
Once the backup is done you should have:
- A backup of the database in .tar format
- A backup of the content of the file share which includes your applications, application content, archived logs, extensions,…
- Backups of any data source files that need to be migrated and are not stored in the shared folder like QVDs
Then we can go ahead and…
Deploy and restore the new central environment
The next steps are to deploy and restore your central node. In this scenario, we will also assume that the new central node will have a different name than the original one (just to make things a bit more complicated 😊).
Let’s start by installing Qlik Sense on the central node. That’s as straightforward as any other fresh install.
You can follow our documentation. Before clicking on Install simply uncheck the box “Start the Qlik Sense services when the setup is complete.”
The version of Qlik Sense you are going to install MUST be the same as the one the backup is taken on.
Now that Qlik Sense is deployed you can restore the backup you have taken earlier into your new Qlik Sense central node following Restoring a Qlik Sense site.
Since the central node server name has also changed, you need to run a Bootstrap command to update Qlik Sense with the new server name. Instruction are provided in Restoring a Qlik Sense site to a machine with a different hostname.
The central node is now almost ready to start.
If you have changed the Qlik Share location, then the UNC path has also changed and needs to be updated.
To do that:
- Go to C:\Program Files\Qlik\Sense\Repository\Util\QlikSenseUtil
- Run QlikSenseUtil.exe as Administrator
- Click on Connect to the database and enter the credential to connect to the new PostgreSQL database
- Click on Service Cluster and press OK. This should display the previously configured UNC Path
- You simply need to update each path, save and start/restart all the Qlik sense services.
At this point make sure you can access the Qlik Sense QMC and Hub on the central node. Eventually, check that you can load applications (using the central node engine of course). You can also check in the QMC > Service Cluster that the changes you previously made have been correctly applied.
Troubleshooting tips: If after starting the Qlik Sense services, you cannot access the QMC and/or Hub please check the following knowledge article How to troubleshoot issue to access QMC and HUB
What about my rim nodes?
You’ve made it here?! Then congratulations you have passed the most difficult part.
If you had already run and configured rim nodes in your environment that you now need to migrate as well, you might not want to remove them from Qlik Sense to add the new ones since you will lose pretty much all the configuration you have done so far on these rim nodes.
By applying the following few steps I will show you how to connect to your “new” rim node(s) and keep the configuration of the “old” one(s).
Let’s start by installing Qlik Sense on each rim node like it was a new one.
The process is pretty much the same as installing a central node except that instead of choosing “Create Cluster”, you need to select “Join Cluster”
Detailed instructions can be found on help.qlik.com: Installing Qlik Sense in a multi-node site
Once Qlik Sense is installed on your future rim node(s) and the services are started, we will need to connect to the “new” Qlik Sense Repository Database and change the hostname of the “old” rim node(s) to the “new” one so that the central node can communicate with it.
To do that install PGAdmin4 and connect to the Qlik Sense Repository Database. Detailed instruction in Installing and Configuring PGAdmin 4 to access the PostgreSQL database used by Qlik Sense or NPrinting knowledge article.
Once connected navigate to Databases > QSR > Schemas > public > Tables
You need to edit the LocalConfigs and ServerNodeConfigurations table and change the Hostname of your rim node(s) from the old one to the new corresponding one (Don’t forget to Save the change)
LocalConfigs table
ServerNodeConfigurations table
Once this is done, you will need to restart all the services on the central node.
When you have access back, login to the QMC and go to Nodes. Your rim node(s) should display the following status, “The certificate has not been installed”
From this point, you can simply select the node, click on Redistribute and follow the instruction to deploy the certificates on your rim node. After a moment the status should change and you should see the services being up and running.
Do the same thing on the remaining rim node(s).
Troubleshooting tips: If the rim node status is not showing “The certificate has not been installed” it means that either the central node cannot reach the rim node or the rim node is not ready to receive new certificates.
Check that the port 4444 is opened between the central and rim node and make sure the rim node is listening on port 4444 (netstat -aon in command prompt).
Still no luck? You can completely uninstall Qlik Sense on the rim node and reinstall it.Finalizing your migration
At this point, your environment is completely migrated and most of the stuff should work.
Data Connection
There is one thing to consider in this scenario. Since the Qlik Sense certificates between the old environment and the new one are not the same, it is likely that data connections with passwords will fail. This is because passwords are saved in the repository database with encryption. That encryption is based on a hash from the certs. When the Qlik Sense self-signed cert is rebuilt, this hash is no longer valid, and so the saved data connection passwords will fail. You will need to re-enter the passwords in each data connection and save. This can be done in the QMC -> Data Connections.
See knowledge article: Repository System Log Shows Error "Not possible to decrypt encrypted string in database"
Licensing
Do not forget to turn off your old Qlik Sense Environment once you are finished. While Qlik's Signed License key can be used across multiple environments, you will want to prevent accidental user assignments from the old environment.
Note: If you are still using a legacy key (tokens), the old environment must be shut down immediately, as you can only use a legacy license on one active Qlik Sense environment. Reach out to your account manager for more details.
Best practices
Finally, don’t forget to apply best practices in your new environment:
- Qlik Sense Folder And Files To Exclude From AntiVirus Scanning
- Recommended practice on configuration for Qlik Sense
-
The 2026 Data Trends Are Here. Is Education Ready?
Data is at the center of the AI revolution. But as Bernard Marr explains in his Forbes article The 8 Data Trends That Will Define 2026 the biggest ch... Show MoreData is at the center of the AI revolution. But as Bernard Marr explains in his Forbes article The 8 Data Trends That Will Define 2026 the biggest changes are not just technical; they are changing how people work, learn, and build careers.
These 2026 data trends are already reshaping education and jobs.
-
AI agents and agent-ready data are changing how work gets done, making it essential to understand how data is structured, accessed, and secured.
-
Generative AI for data engineering is automating technical tasks, shifting skills toward design, logic, and critical thinking.
-
Data provenance and trust are becoming core requirements as data volumes grow, and decisions rely more on AI.
-
Compliance and regulation are expanding globally, making responsible data use a necessary skill across roles.
-
Generative data democracy allows more people to access insights, increasing the importance of data literacy for everyone.
-
Synthetic data is opening new opportunities while raising ethical and privacy considerations.
-
Data sovereignty is shaping how organizations manage data across borders and jurisdictions.
Together, these trends show why data literacy is becoming a universal skill for education and careers in 2026.
The Qlik Academic Program helps academic communities respond to these changes by putting data literacy at the center of learning. Students develop the ability to read, question, and explain data while working hands-on with real analytics tools to explore data, build insights, and understand how AI-driven decisions are made. Professors are supported with training and teaching resources that make it easier to embed data literacy and modern data topics across disciplines.
As the Forbes article makes clear, the future belongs to those who can work confidently with data, alongside AI, within regulations, and with trust.
By giving students, professors, and universities free access to analytics software, learning content, and certifications, the Qlik Academic Program helps education stay aligned with the data trends shaping 2026 and prepares learners for the jobs of tomorrow.
Join our global community for free: Qlik Academic Program: Creating a Data-Literate World
-
-
Watch! Q&A with Qlik: New to Qlik Cloud
Don't miss our previous Q&A with Qlik! Hear from our panel of experts to help you get the most out of your Qlik experience. Let our Qlik experts offer... Show MoreDon't miss our previous Q&A with Qlik! Hear from our panel of experts to help you get the most out of your Qlik experience.
Let our Qlik experts offer solutions to common issues encountered when upgrading Qlik Sense, best practices, and important configuration settings.

-
Latest from the Qlik Community
Hi Qlik Community, We hope everyone had a wonderful holiday season and a great start to the new year! As we settle into 2026, we wanted to take a mome... Show MoreHi Qlik Community,
We hope everyone had a wonderful holiday season and a great start to the new year! As we settle into 2026, we wanted to take a moment to reflect on what we’ve been working on over the past couple of months and share a few important updates, improvements, and upcoming opportunities with you.
Here’s a look at what’s new across the Qlik Community!
New Data Integration & Quality Forum: Qlik Open Lakehouse
We’re excited to share that we’ve launched a brand-new Qlik Open Lakehouse forum!
This space is dedicated to discussions around Open Lakehouse architectures, Apache Iceberg, and how Qlik supports modern, flexible data ecosystems. Whether you’re exploring open formats, optimizing performance, or thinking about governance at scale, this forum is designed to support those conversations.
We encourage you to subscribe and start asking questions and sharing insights!
Forum Updates
We’ve recently merged the Data Integration Component Development forum into the Talend Studio forum to better align related discussions across the Community. This change helps ensure questions, knowledge, and expertise live in a single, centralized space.
A dedicated label is available in the Talend Studio forum to clearly identify posts that originated from the Data Integration Component Development forum.
Homepage Carousel Improvements
You may have noticed a change to the Community homepage carousel. We’ve slowed down the rotation to give you more time to absorb each message, and we’ve added a pause button so you can control the experience yourself. This update reflects our continued commitment to making Community content easier to explore and more enjoyable to use.
Recent Fixes & Improvements
We’ve also resolved a few behind-the-scenes issues:
- A bug where selected time zones were displayed incorrectly for some users has now been fixed
- Navigation inconsistencies - where some users were seeing different layouts than others - have also been resolved
Thank you to everyone who flagged these gaps!
Scavenger Hunt Recap
Thank you to everyone who participated in our Qlik Community Scavenger Hunt!
We saw fantastic engagement across the Community, with over 100 submissions during the hunt. Five winners were selected and have received exclusive Qlik swag as a thank-you for completing the challenge.
If you missed it or want to see how it played out, you can check out the full recap post here!
Keep an eye out, we hope to bring back more interactive Community activities like this in the future.
Just in Case You Missed It -
Before we wrap up, here are a few things worth checking out:
Qlik Connect Session Catalog
Have you explored the Qlik Connect session catalog yet? Discover 100+ sessions, workshops, certifications, and networking opportunities, check it out!
Trends 2026 Outlook – January 14
Join us for the highly anticipated Trends 2026 Outlook with Dan Sommer, Market Intelligence Lead at Qlik. He’ll reveal the trends underpinning a new framework for powering AI that ensures integrity, connects every system seamlessly, and fuels innovation at the edge, and map out how to get there. Registration is now open, and the session will be available on January 14.
Q&A with Qlik
Looking to better understand how to get started finding data insights with Qlik Cloud? Our Q&A with Qlik sessions give you the chance to connect directly with Qlik experts who can help guide you through the basics and beyond. Register here!
That’s all for now! Thank you, as always, for being an active and engaged part of the Qlik Community. We’re looking forward to an exciting year ahead and can’t wait to share more with you soon.
Your Qlik Community Managers,
Sue, Jamie, Caleb, and Brett -
Upcoming changes to Qlik Talend Nexus Repository January 26th, 2026
Hello Qlik Talend admins, Qlik is updating the Qlik Talend Nexus repository. The changes are rolled out in a phased approach. Phase One was completed ... Show MoreHello Qlik Talend admins,
Qlik is updating the Qlik Talend Nexus repository. The changes are rolled out in a phased approach. Phase One was completed on July 16th, 2025.
Phase Two is scheduled for January 26th, 2026.
What is the expected impact?
The impact is minimal.
Qlik Talend Studio:
- no impact
Qlik Talend Administration Center
- version lower than 8.0.1 with R2025-07 patch: you'll no longer see any patches in the Qlik Talend Administration Center UI
- version 8.0 with patch R2025-07 or higher: you'll see all patches available in the Qlik Talend Administration Center UI
If you have any questions, we're happy to assist. Reply to this blog post or start a chat with us.
Thank you for choosing Qlik,
Qlik Support -
New Feature: Templates
Qlik and Qlik Cloud are always innovating, adding new features to make the user experience even better. Today I would like to tell you about Qlik’s ne... Show MoreQlik and Qlik Cloud are always innovating, adding new features to make the user experience even better. Today I would like to tell you about Qlik’s newest feature: Templates. Templates are a new feature in Qlik Cloud that prompts the user when creating a new sheet.
To use Templates, go into any Qlik Cloud app and click on ‘sheets’ then ‘Create new sheet’.
There you will be greeted with the new Templates feature. Please know that if you do not wish to see this screen when you are creating a new sheet, you can simply uncheck the box next to ‘Show when creating a sheet’.
The Templates feature is broken down into a few different categories to help navigate the feature. The vast number of Templates available can seem a bit overwhelming, but if you find a template that you find yourself using often, you can click on the star next to it to add it to your ‘Favorites’.
Additionally, if you would like the freedom to create your own sheet, without a template, you can simply select the ‘Empty sheet’ option.
Using a template is easy!
Let’s take a look at one of the templates from the Highlights section ‘Charts with filters on the side’. With just the click of a button, my new sheet with the various placeholders for my charts has been created.
From here I can begin creating my sheet. As we can see, charts have been added to the sheet, including a Straight table at the bottom, KPIs at the top, and Bar charts in the middle with our Filter Panes to the side. Of course, I have the freedom to add, delete and change these charts as I see fit.
Then we add a bit of color and add a bit of spacing.
And we have a finished sheet! Of course there is still so much more we could do with this sheet to customize it to our needs, but it’s a start!
There are so many templates that you can use to help create your sheets. Take a look at new Template feature and drop which template you think will be most useful. Thank you for reading!
-
Why Adding Analytics Doesn’t Have to Be Hard for Professors
Why Qlik Makes It Easy As data literacy and analytics becomes essential across higher education, many faculty want to introduce analytics into their c... Show MoreWhy Qlik Makes It EasyAs data literacy and analytics becomes essential across higher education, many faculty want to introduce analytics into their courses—but hesitate for one simple reason: time.For most professors, the challenge isn’t interest—it’s practicality. Traditional analytics tools often require:-
Significant time to learn and teach
-
Building course materials from scratch
-
Managing software access and technical issues
-
Justifying tools that don’t clearly align with real-world outcomes
When added together, these hurdles can make analytics feel like more work than impact. Qlik’s Academic Program is designed with faculty realities in mind.Professors get:-
Ready-to-use course materials (syllabi, labs, and assessments)
-
Easy, cloud-based access with no cost or complex setup
-
Flexible integration, from a single module to a full course
-
Industry-relevant analytics tools students actually use in the workforce
Instead of asking faculty to redesign their courses, Qlik fits seamlessly into what they already teach. Adding an analytics tool doesn’t have to be difficult.Qlik removes the biggest barriers—time, complexity, and curriculum creation—making it one of the easiest analytics programs for professors to adopt and teach.Explore more here: https://www.qlik.com/us/company/academic-program -
-
Mastering the HyperCube: High-Volume Data Strategies with @qlik/api
If you have been building custom web applications or mashups with Qlik Cloud, you have likely hit the "10K cells ceiling" when using Hypercubes to fet... Show MoreIf you have been building custom web applications or mashups with Qlik Cloud, you have likely hit the "10K cells ceiling" when using Hypercubes to fetch data from Qlik.
(Read my previous posts about Hypercubes here and here)You build a data-driven component, it works perfectly with low-volume test data, and then you connect it to production; and now suddenly, your list of 50,000+ customers cuts off halfway, or your export results look incomplete.
This happens because the Qlik Engine imposes a strict limit on data retrieval: a maximum of 10,000 cells per request. If you fetch 4 columns, you only get 2,500 rows (4 (columns) x 2500 = 10,000 (max cells)).
In this post, I’ll show you how to master high-volume data retrieval using the two strategies: Bulk Ingest and On-Demand Paging, using the @qlik/api library.
What is the 10k Limit and Why Does It Matter?
The Qlik Associative Engine is built for speed and can handle billions of rows in memory. However, transferring that much data to a web browser in one go would be inefficient. To protect both the server and the client-side experience, Qlik forces you to retrieve data in chunks.
Understanding how to manage these chunks is the difference between an app that lags and one that delivers a good user experience.
Step 1: Defining the Data Volume
To see these strategies in action, we need a "heavy" dataset. Copy this script into your Qlik Sense Data Load Editor to generate 250,000 rows of transactions (or download the QVF attached to this post):
// ============================================================
// DATASET GENERATOR: 250,000 rows (~1,000,000 cells)
// ============================================================

Transactions:
Load
    RecNo() as TransactionID,
    'Customer ' & Ceil(Rand() * 20000) as Customer,
    Pick(Ceil(Rand() * 5),
        'Corporate',
        'Consumer',
        'Small Business',
        'Home Office',
        'Enterprise'
    ) as Segment,
    Money(Rand() * 1000, '$#,##0.00') as Sales,
    Date(Today() - Rand() * 365) as [Transaction Date]
AutoGenerate 250000;
Step 2: Choosing Your Strategy
There are two primary ways to handle this volume in a web app. The choice depends entirely on your specific use case.
1- Bulk Ingest (The High-Performance Pattern)
In this pattern, you fetch the entire dataset into the application's local memory in iterative chunks upon loading.
-
The Goal: Provide a "zero-latency" experience once the data is loaded.
-
Best For: Use cases where users need to perform instant client-side searches, complex local sorting, or full-dataset CSV exports without waiting for the Engine.
2- On-Demand (The "Virtual" Pattern)
In this pattern, you only fetch the specific slice of data the user is currently looking at.
-
The Goal: Provide a near-instant initial load time, regardless of whether the dataset has 10,000 or 10,000,000 rows as you only load a specific chunk of those rows at a time.
-
Best For: Massive datasets where the "cost" of loading everything into memory is too high, or when users only need to browse a few pages at a time.
Step 3: Implementing the Logic
While I'm using React and custom react hooks for the example I'm providing, these core Qlik concepts translate to any JavaScript framework (Vue, Angular, or Vanilla JS). The secret lies in how you interact with the HyperCube.
The Iterative Logic (Bulk Ingest):
The key is to use a loop that updates your local data buffer as chunks arrive.
To prevent the browser from freezing during this heavy network activity, we use setTimeout to allow the UI to paint the progress bar.
        qModel = await app.createSessionObject({ qInfo: { qType: 'bulk' }, ...properties });
        const layout = await qModel.getLayout();
        const totalRows = layout.qHyperCube.qSize.qcy;
        const pageSize = properties.qHyperCubeDef.qInitialDataFetch[0].qHeight;
        const width = properties.qHyperCubeDef.qInitialDataFetch[0].qWidth;
        const totalPages = Math.ceil(totalRows / pageSize);

        let accumulator = [];
        for (let i = 0; i < totalPages; i++) {
          if (!mountedRef.current || stopRequestedRef.current) break;

          const pages = await qModel.getHyperCubeData('/qHyperCubeDef', [{
            qTop: i * pageSize,
            qLeft: 0,
            qWidth: width,
            qHeight: pageSize
          }]);

          accumulator = accumulator.concat(pages[0].qMatrix);

          // Update state incrementally
          setData([...accumulator]);
          setProgress(Math.round(((i + 1) / totalPages) * 100));

          // Yield thread to prevent UI locking
          await new Promise(r => setTimeout(r, 1));
The Slicing Logic (On-Demand)
In this mode, the application logic simply calculates the qTop coordinate based on the user's current page index and makes a single request for that specific window of data (rowsPerPage).
        const width = properties.qHyperCubeDef.qInitialDataFetch[0].qWidth;
        const qTop = (page - 1) * rowsPerPage;

        const pages = await qModelRef.current.getHyperCubeData('/qHyperCubeDef', [{
          qTop,
          qLeft: 0,
          qWidth: width,
          qHeight: rowsPerPage
        }]);

        if (mountedRef.current) {
          setData(pages[0].qMatrix);
        }
I placed these two methods in custom hooks (useQlikBulkIngest & useQlikOnDemand) so they can be easily re-used in different components as well as other apps.
Best Practices
Regardless of which pattern you choose, always follow these three Qlik Engine best practices:
-
Engine Hygiene (Cleanup): Always call app.destroySessionObject(qModel.id) when your component or view unmounts.
-
Cell Math: Always make sure your qWidth x qHeight is strictly < 10,000. For instance, if you have a wide table (20 columns), your max height is only 500 rows per chunk.
-
UI Performance: Even if you use the "Bulk" method and have 250,000 rows in JavaScript memory, do not render them all to the DOM at once. Use UI-level pagination or virtual scrolling to keep the browser responsive.
Choosing between Bulk and On-Demand is a trade-off between Initial Load Time and Interactive Speed. By mastering iterative fetching with the @qlik/api library, you can ensure your web apps remain robust, no matter how much data is coming in from Qlik.
Attached is the QVF and here is the GitHub repository containing the full example in React so you can try it in locally - Instructions are provided in the README file.
(P.S: Make sure you create the OAuth client in your tenant and fill in the qlik-config.js file in the project with your tenant-specific config).
Thank you for reading!
-
-
Unlock Your Qlik Superpower
Not sure where to begin your Qlik journey? The Qlik Skills Assessment is a free, easy-to-use tool that helps you quickly evaluate where you are on you... Show MoreNot sure where to begin your Qlik journey? The Qlik Skills Assessment is a free, easy-to-use tool that helps you quickly evaluate where you are on your Qlik learning journey. Once you complete the assessment, you’ll receive training recommendations designed to strengthen and expand your skills.
We’ve expanded our assessments to include Qlik Data Analytics and Data Integration, with 11 Skills Assessments now available to you.
Why take a Skills Assessment?
- Understand where you are on your Qlik Learning journey
- Get clear guidance on which training to take next
- Measure team skill levels and identify gaps
- Retake assessments to track ongoing progress
- Compare skill levels before and after training
How do I take a Skills Assessment?
- Access the Skills Assessments page. If you’re logged into Qlik Learning, navigate to
Topics menu → Skills Assessment. - Select the Product/Capability Skills Assessment you would like to take.
- Complete the assessment in 30 minutes and receive your results and learning recommendations immediately.
Track your progress
- View your results anytime under My Learning → History.
- Retake assessments to monitor skill growth over time and measure the impact of your training.
Take your Qlik Skills Assessment today to understand where you are on your learning journey—and get the guidance you need to build and expand your Qlik expertise with confidence. 🚀

-
【オンデマンド配信】AI の未来を創る:データ・エージェント・人間のタッグが生む新たな価値
AI を活用して投資利益率を高める 2026年のトレンド 多くの企業が AI に投資しているにもかかわらず、投資利益率を高めている企業はごく少数です。何を改善すべきなのか? 何十年もの間、企業は振り子のように揺れ動いてきました。前進している時は自由度を高め、後退している時は規律を強める…を繰り返し... Show MoreAI を活用して投資利益率を高める 2026年のトレンド
多くの企業が AI に投資しているにもかかわらず、投資利益率を高めている企業はごく少数です。何を改善すべきなのか?
何十年もの間、企業は振り子のように揺れ動いてきました。前進している時は自由度を高め、後退している時は規律を強める…を繰り返してきました。2026年のデータで成功する戦略モデルは、二者択一ではありません。管理とイノベーションを両立して活かし、新たな価値を生み出すことが重要になります。
Web セミナー「AI の未来を創る:データ・エージェント・人間のタッグが生む新たな価値」では、Qlik のマーケットインテリジェンスリードの Dan Sommer と Qlik APAC の分析・AI 部門 最高技責任者の Charlie Farah が、2026年の重要なトレンドについて解説します。
本 Web セミナーでは、ビジネスを成功に導くために押さえるべき 3 つの重要なポイントをご紹介します。このポイントをビジネスに適用すると、データの整合性を確保してすべてのシステムをシームレスにつなぎ、ビジネスに革新を起こすことができます。さらに、この新たなモデルの基礎となるトレンドを探ることで、貴社のデータ戦略をレベルアップする方法も解説します。
偏った方針に振り回されることなく、分断を解消して統合基盤を構築するには?Web セミナーに参加して、AI を最大限に活用するために、新たなモデルの導入の重要性をご確認ください。
※ 参加費無料。日本語字幕付きでお届けします。パソコン・タブレット・スマートフォンで、どこからでもご参加・ご視聴いただけます。
-
Dynamic Engine Now Supports Google Kubernetes Engine: Deploy Anywhere, Scale Eve...
V1 milestone reinforces Dynamic Engine as the most versatile, cloud-agnostic execution runtime for enterprise data integration and API workloads. ... Show MoreV1 milestone reinforces Dynamic Engine as the most versatile, cloud-agnostic execution runtime for enterprise data integration and API workloads.
Multi-Cloud by Design: Meeting Industries Where They Are
Different industries have distinct cloud preferences, driven by existing vendor relationships, regulatory requirements, and regional data residency mandates:
- Financial Services & Healthcare often rely on Azure for compliance-ready environments and tight integration with Microsoft enterprise ecosystems.
- Retail, Media & E-commerce frequently leverage AWS for its mature services catalog, global reach, and scale.
- Technology & SaaS companies increasingly adopt Google Cloud (GKE) for its cutting-edge AI/ML capabilities, data analytics tools (BigQuery), and developer-first infrastructure.
- Manufacturing & Government may deploy on-premises or hybrid environments for data sovereignty, air-gapped scenarios, or legacy system integration.
With Dynamic Engine, you can now deploy a unified data integration runtime across all these environments, using the same orchestration, monitoring, and management tools via Talend Management Console (TMC).
GKE Support: Cloud-Native Power Meets Google Innovation
Dynamic Engine on Google Kubernetes Engine (GKE) brings the same enterprise-grade capabilities customers already enjoy on AWS and Azure, now optimized for Google Cloud infrastructure:
- Conformance with GKE standards: Dynamic Engine adheres to GKE specificities and best practices.
- Multi-version compatibility: Supports Kubernetes versions 1.30 through 1.34, with Dynamic Engine versions 0.22.x through 1.0.x.
- Work-in-progress: GKE-Autopilot and EKS Auto-mode are on the roadmap, further simplifying cluster management.
Kubernetes versions
Compatible Dynamic Engine versions
1.30
0.23, 0.24, 1.0
1.31
0.23, 0.24, 1.0
1.32
0.23, 0.24, 1.0
1.33
0.24, 1.0
1.34
0.24, 1.0
For detailed setup instructions, see our official guide: Configuring Google Kubernetes Engine.
Helm: Effortless Deployment, Enterprise-Grade Customization
One of Dynamic Engine's standout features is its native Helm support, which dramatically simplifies deployment while offering deep customization for enterprise DevOps teams.
Why Helm Matters
Helm transforms Dynamic Engine deployment into a repeatable, version-controlled, GitOps-ready process:
- One-command deployment: Deploy engine instances and environments with simple helm install commands.
- Custom namespaces: Define your own namespace conventions to align with internal Kubernetes governance.
- Custom registries & air-gap support: Deploy in fully disconnected environments using your own container registries.
- HTTP proxy configuration: Integrate seamlessly with corporate proxies for secure, compliant deployments.
- Reusable configurations: Store and version your values.yaml files alongside infrastructure-as-code.
Helm charts for Dynamic Engine are publicly available and include:
- Core custom resource definitions
- Engine instance chart
- Environment-specific chart
For complete guidance, see: Recommended Helm Deployment.
Air-Gap Ready: Secure Deployments for Regulated Environments
For organizations operating in highly secure, air-gapped, or disconnected environments (common in defense, government, financial services, and healthcare), Dynamic Engine offers full support for:
- Custom Docker registries: Pull engine images from your own internal registry (e.g., Artifactory, Harbor, or private GCR/ECR/ACR).
- Private Helm chart repositories: Host and serve Helm charts internally.
- HTTP/HTTPS proxy support: Route traffic through corporate gateways with full TLS/mTLS support.
This makes Dynamic Engine one of the few enterprise data integration platforms that can operate in zero-trust, fully isolated network environments.
DevSecOps-Ready: Advanced Customization for Enterprise Standards
Dynamic Engine goes far beyond basic deployment, offering a rich set of enterprise customization capabilities:
- Signed artifacts for DevOps security: Verify the integrity of job artifacts using custom keystores, ensuring only trusted code runs in production.
- Custom namespaces: Align with your Kubernetes governance and multi-tenancy strategy.
- Custom StorageClass: Specify persistent volume configurations optimized for your infrastructure (e.g., SSD-backed volumes for high-throughput workloads).
- Custom trust stores: Securely connect to external services (databases, APIs, LDAP) using enterprise certificate authorities.
- Log management: Optionally deactivate log transfer to TMC for full on-prem log retention and compliance.
For advanced configurations, explore: Additional Customization with DevSecOps.
Frictionless Upgrades: Zero Downtime, Always
One of Dynamic Engine's most compelling features is its built-in, no-downtime upgrade mechanism.
How It Works
- Single version per release: Each monthly release includes one consolidated Dynamic Engine version, simplifying lifecycle management.
- Simple wizard in TMC: Pick a new version, download updated manifests or Helm charts, and apply - no complex migration scripts.
- GitOps-friendly: Use helm upgrade with --reuse-values to preserve customizations while applying new versions.
- No impact on running jobs: During upgrades, active tasks continue execution without interruption - critical for 24/7 production environments.
Learn more: Upgrading Dynamic Engine Version.
The Bottom Line: Cloud Freedom Without Compromise
With Google Kubernetes Engine support, Helm-based deployment, air-gap readiness, and zero-downtime upgrades, Dynamic Engine delivers:
- True cloud portability: Deploy on AWS, Azure, Google Cloud, or on-premises with the same codebase and management experience.
- Industry-aligned flexibility: Meet your organization where it is - whether you're cloud-first, hybrid, or air-gapped.
- Enterprise DevOps practices: GitOps, IaC, CI/CD, custom registries, and advanced security - all supported out of the box.
- Operational simplicity: No more patching downtime, no more manual upgrade scripts, no more vendor lock-in.
Dynamic Engine isn't just a runtime - it's a future-proof platform for data integration at enterprise scale, across any cloud, any Kubernetes distribution, and any regulatory environment.
Resources & Documentation
- Dynamic Engine Configuration Guide
- Configuring Google Kubernetes Engine
- Recommended Helm Deployment
- Upgrading Dynamic Engine
- Custom Namespace Setup
- Dynamic Engine Prerequisites
Ready to deploy Dynamic Engine on GKE, or take your existing AWS/Azure deployments to the next level with Helm customization? Reach out to your Qlik Talend account team or explore our documentation to get started today.
-
統合が進む市場では、データ統合が競争優位を左右する(Qlik Blog 翻訳)
ブログ著者:Drew Clarke 本ブログは「In a Consolidating Market, Data Integration Is Your Control Point」の翻訳になります。 Gartner 社は、「Gartner® データ統合ツールの Magic Quadrant」におい... Show Moreブログ著者:Drew Clarke
本ブログは「In a Consolidating Market, Data Integration Is Your Control Point」の翻訳になります。Gartner 社は、「Gartner® データ統合ツールの Magic Quadrant」において、再び Qlik をリーダーの 1 社として評価しました。Qlik は、今回で 10年連続の快挙を達成しました。この 10年間、データ統合を取り巻く環境は大きく変化しました。大規模なクラウドコンピューティングサービスを提供する企業群は存在感を高め、大手ベンダーは囲い込みを強化してきました。さらに、企業の買収が顧客の選択肢そのものを再編しています。
市場の統合が進んでいる今、最高情報責任者や最高データ責任者が考えるべきポイントが変わってきています。「Magic Quadrant のポジション」よりも、「自社のデータおよび AI 戦略の推進と継続性」が重要になっています。Deloitte 社が実施したグローバル CIO 調査においても同じ方向性が示されました。クラウドや AI を活用した業務が増えているが、ベンダー依存の回避とアーキテクチャの柔軟性の維持が、これまで以上に重要な課題となっています。
リアルタイム・ハイブリッド・オープン
高性能な CDC(変更データキャプチャ)と複製
Qlik のログベースの変更データキャプチャおよび複製は、市場でもトップクラスと評価されています。データベース・メインフレーム・クラウドなど、あらゆる環境間で信頼性の高いリアルタイムの連携を実現します。これにより、ゼロダウンタイムでハイブリッドクラウドへデータを移行することが可能になり、リアルタイムのリスク管理と業務運用をサポートします。膨大なデータの移行と変換
Gartner 社は、膨大なデータやバッチ処理におけるデータ移行と変換機能のパフォーマンスについても高く評価しています。ここで求められるのは、負荷が増大しても安定して動作し、本番環境での想定外のトラブルを最小限に抑制できることです。これにより、日々の運用維持に縛られずに AI や分析といった新たな価値の創出に注力できるようになります。ハイブリッドおよびマルチクラウド対応の幅広いコネクター
Qlik が提供している幅広いコネクター、オンプレミス・クラウド・レイクハウス環境におけるサポートは、小さな機能や細かい仕様に見えますが、実際は運用の柔軟性をサポートする立役者です。ある業務はオンプレミスで、別の業務は AWS / Azure / Google Cloud で実行するといった柔軟な運用が可能になります。また、新しいデータ形式(Apache Iceberg など)を導入する際に、既存の統合戦略を策定し直す必要もありません。ガバナンス・メタデータ管理・AI 活用への対応
Gartner 社は、Qlik のメタデータ管理とガバナンスを市場の平均以上と評価しており、データパイプライン全体の系統・ポリシーの適用・データの流れの可視化などが含まれます。AI がより重要な業務に介入するようになり、データの出所や利用方法における規制当局の監視が厳しくなっている中、こうした機能はオプションではなく必須となっています。
特許取得済みの Qlik Trust Score for AI は、AI がアシストするパイプライン設計や品質チェックにも活用されており、メタデータ管理とガバナンスの基盤で機能します。管理できるデータのみが、自動化と信頼度評価の対象になります。レイクハウスと AI の活用 - 運用の柔軟性も維持
Qlik のオープンレイクハウスや Apache Iceberg の取り込み、圧縮、ハイブリッド複製に関する取り組みは、先進的なレイクハウス戦略を証明するものだと評価されています。Icebergは、複数の処理エンジンで同じデータを共有できるオープンテーブル形式のため、エンジニアリング・コスト効率・リスク管理のすべてにおいて優れています。
管理された Iceberg テーブルに一度データを置くだけで、データウェアハウス・AI・分析ツールで即座に利用できるようになります。複雑でコストを要する複数のデータのコピーを作成する必要はありません。信頼できるデータ製品、オープンなレイクハウスレイヤー、AI がサポートする統合を組み合わせると、無意識にデータ活用にAI を使えるようになります。個別の特別なプロジェクトとして扱う必要はありません。
統合が進む市場での独立性
Magic Quadrant で見落としがちな一行ですが、Qlik は引き続き独立性を維持し、ハイブリッド環境に対応したオープンプラットフォームを提供しています。
もしデータ統合プラットフォームが CRM ベンダーや主要クラウドが所有している場合、プラットフォームはどうしてもベンダーの都合に合わせた設計になります。ロードマップや価格設定、機能やデータ連携の範囲なども影響を受けます。
一方で、独りした統合プラットフォームなら、自由な選択肢と交渉力を確保することができます。クラウドやデータウェアハウスを自由に組み合わせたり、価値に応じて条件を交渉したり、性能・コスト・規制の変化に応じて柔軟に移行することも可能です。これが私が主張したい「自由」です。自社のビジネスに必要なデータファブリックや AI 環境を設計し、状況の変化に応じてゼロから構築し直すこともなく柔軟に変更できる状態なのです。
まとめ
Magic Quadrant の図を度外視すると、今年のレポートで伝えたいことはシンプルです。リアルタイム対応、ハイブリッド環境、オープンアーキテクチャは、今の標準要件となっています。ガバナンスやメタデータ管理、AI 活用の準備は、意思決定の需要な判断基準になりつつあります。さらに、市場の統合が進む中でも、独立性と柔軟性は変わらず重要です。
この Magic Quadrant の評価は、Qlik の取り組みが正しい方向に進んでいることを示しています。CDC や膨大なデータの移行、コネクタ、ガバナンス、レイクハウス、AI 支援の統合といった一貫した取り組みが評価されたと言えます。
データリーダーが重要視していることは、シンプルです。
- 必要な時に、クラウドやデータウェアハウス、基幹システム間で自由にデータを移行できるのか。移行する度にゼロからやり直す必要はないのか。
- データが AI や規制に対応できる状態であることを、明確な系統、ポリシーの適用、信頼の指標で証明できるのか。
- 単一の統合されたデータ基盤を運用しているのか。もしくは分散したツールを寄せ集めた状態なのか。そして、それがコスト、リスク、スピードにどう影響するのか。
こうしたポイントに対応できるのが、Qlik Talend Cloud / Qlik オープンレイクハウス / AI 支援の統合アプローチです。
データ統合ツール分野で 10年連続でリーダーの 1 社に評価された功績を誇らしく感じますが、本当に重要なのは、実際にプラットフォームを使用した際の自由な操作性と管理を実感いただけることです。
-
【新着レポート】Qlik、データ統合ツールで 10 年連続リーダーの 1 社に!
Gartner 社は、「2025年 Gartner® データ統合ツールの Magic Quadrant」を発表しました。Gartner 社が評価した 20 社のデータ統合メーカーの中で、Qlik は 10 年連続でリーダーの 1 社に評価されました。 データはこれまで以上に多くのシステム間で高速で... Show MoreGartner 社は、「2025年 Gartner® データ統合ツールの Magic Quadrant」を発表しました。Gartner 社が評価した 20 社のデータ統合メーカーの中で、Qlik は 10 年連続でリーダーの 1 社に評価されました。
データはこれまで以上に多くのシステム間で高速で移行し、AI 主導の意思決定の要となっています。信頼できるデータ統合基盤は、このような状況を支えるだけではなく、極めて重要なものとなっています。
自社に最適なプラットフォームを選択するには?本レポートで 詳細をご確認ください。-
データ統合市場における Gartner 社 のインサイト
-
Qlik がリーダーの 1 社に評価された理由
-
データ統合市場における各メーカーの評価
-
-
Some of the best Qlik Sense extensions created so far
Since the release of Sense back in September 2014 a lot of good things have happened to the product. If you look back you almost can’t believe that it... Show MoreSince the release of Sense back in September 2014 a lot of good things have happened to the product. If you look back you almost can’t believe that it was just 6 months ago when we launched Sense. Since then, R&D guys and girls have added quite a lot of improvements and new functionality (and more is coming next) into the product.
Today, I don’t want a focus on the company’s centralized development. We talk enough about ourselves here, but on the decentralized Sense development guerrilla from out there. Since January 26 these individuals contributing with a fresh view to Qlik Sense (to QlikView as well) have a place to share their ideas and Open Source projects. It’s called Qlik Branch and it’s open for everyone to join.
From all the projects already submitted to Qlik Branch, I will nominate 3 of my favorites created so far.
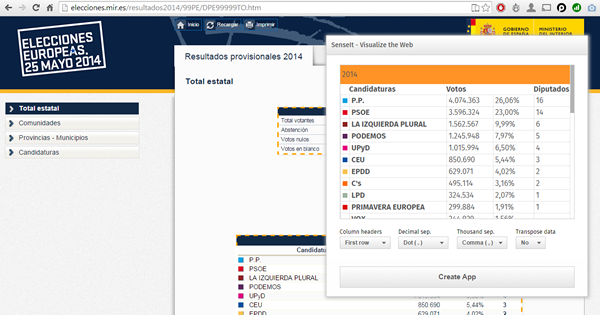
SenseIt by Alex Karlsson
It goes to my personal Top 1 for a variety of reasons but particularly because it opens a completely new and unexplored category for Extensions. We are used to seeing extensions (or visualizations) within the product itself but this is something completely different. SenseIt is a browser extension or plugin that will let you create a new app on the fly by capturing a table from Chrome and loading it as data into your Qlik Sense Desktop. Truly amazing experience and the name is cool too (isn’t it?)
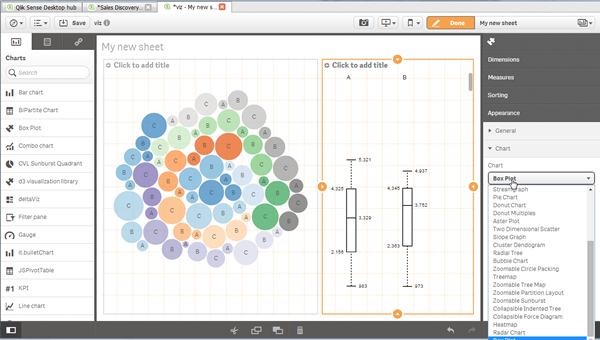
D3 Visualization Library by Speros Kokenes
As a visualization junkie I am, I love D3.js, I truly love some of the beautiful and smart visualizations built around the popular JavaScript library. I have seen (and ported) some of those charts to Sense, one by one, so you end up having a packed chart library on your Sense desktop. Speros have gone a bit further by converting the Visualization object into a truly D3js library where you can go and pick up your favorite D3js visualization, very entertaining. In future releases we might end up having control over the chart colors and some other cool stuff that will make this extension superb, remember you can contribute and make it even better.
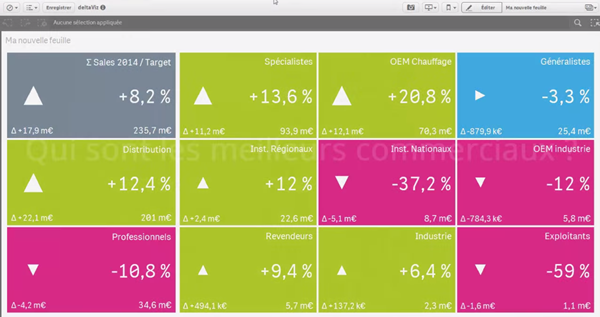
deltaViz self-service dashboard by Yves Blake
For those of us QlikView lovers any addition to the dashboard world in Sense it’s always very much appreciated. If it’s very well executed and designed as it is deltaViz, then there’s no reason to not try it. DetalViz is a complete solution for dashboards focused on comparisons and very well implemented to take advantage of Qlik Sense grid system. If you still have doubts about this visualization, you can see it live here: https://www.youtube.com/watch?v=4s30AEf4qJc
These are my top 3 favorite extensions/visualizations created so far, but what are yours?
AMZ

-
Celebrating a Year of Transformative Learning: Wrapping Up 2025 with the Qlik Ac...
Throughout 2025, the Qlik Academic Program has continued to empower students and educators worldwide by providing free access to our industry-leading ... Show MoreThroughout 2025, the Qlik Academic Program has continued to empower students and educators worldwide by providing free access to our industry-leading data analytics tools. From Qlik Sense to advanced data visualization techniques, we’ve helped thousands of learners gain the skills they need to excel in a data-driven world. Our mission remains the same: to transform education by making analytics accessible, engaging, and practical.
This year, we’ve seen particularly exciting developments in Germany. We welcomed several new universities into the Qlik family, expanding our reach and helping even more students harness the power of data in their coursework. These new partnerships are just one example of how the program is making a difference, bringing data literacy to more classrooms and inspiring the next generation of data-savvy professionals.
For those who haven’t yet taken advantage of the Qlik Academic Program, now is the perfect time to start. The program offers a wealth of resources, qualifications, and free access to Qlik Sense—all designed to help you integrate powerful analytics into your teaching and learning. You can click here https://qlik.com/academicprogram to learn more about how to get started and join us on this exciting journey!
As we wrap up the year, I want to extend a heartfelt thank you to all our educators, students, and partners who have made 2025 such a memorable and impactful year. We’re proud of what we’ve accomplished together and excited for the new possibilities that 2026 will bring.
Stay tuned for more stories, more learning, and more opportunities as we continue to grow the Qlik Academic Program.
Here’s to a great year behind us and an even brighter one ahead!
-
【オンデマンド配信】The AI Reality Tour Tokyo 2025 ダイジェスト
去る 10月 28日(火)に開催しました「The AI Reality Tour Tokyo 2025」では、予測 AI・生成 AI・エージェンティック AI を統合した Qlik の最新製品をご紹介する基調講演をはじめ、Qlik のユーザーが語る先進的な事例、Qlik のパートナー企業による最新の... Show More去る 10月 28日(火)に開催しました「The AI Reality Tour Tokyo 2025」では、予測 AI・生成 AI・エージェンティック AI を統合した Qlik の最新製品をご紹介する基調講演をはじめ、Qlik のユーザーが語る先進的な事例、Qlik のパートナー企業による最新のテクノロジーやソリューション、展示ブースなどで、貴社の AI 戦略を成功に導く最新情報をご紹介しました。
当日の講演の一部をオンデマンドでご視聴いただけます。さらに、オンデマンド配信限定のテクノロジー講演も配信中!ぜひ、この機会にご視聴ください。
※本 Web セミナーは、2025年 10月 28日(火)開催の「The AI Reality Tour Tokyo 2025」 における一部の講演を録画したものです。
※視聴無料。パソコン・タブレット・スマートフォンで、どこからでもご視聴いただけます。
今すぐ視聴する -
Wrapping Up the Semester & Looking Ahead With Qlik
As the fall semester comes to a close, now is the perfect time to pause, enjoy family and friends, and fully embrace the holiday season. Take the time... Show MoreAs the fall semester comes to a close, now is the perfect time to pause, enjoy family and friends, and fully embrace the holiday season. Take the time to relax, regroup, and recharge—you’ve earned it.
When you return refreshed for a new year and a new semester, Qlik has you covered. We’re here to support you with everything you need to bring data analytics to life in your classroom.
For Professors: We Make Next Semester Easy
We provide ready-to-use academic resources, including:
-
Course content
-
Training materials
-
Syllabi
-
Exams
-
Hands-on learning tools
And the best part? You’re not doing it alone.
What I Can Offer You
I’m available to Zoom into your class to introduce Qlik, explain who we are, and walk through the opportunities available through our academic program.
Once your students are signed up, we offer a student workshop designed to build confidence with Qlik from day one. We cover the fundamentals so that when you begin your lessons, students already feel comfortable navigating and using the platform.
Let’s Get You on the Schedule
We’d love to partner with you next semester—and spots will fill up quickly.
Please reach out to me directly to reserve your session or ask any questions.
brittany.fournier@qlik.comDuring the Break
Make sure to get signed up and spend a little time exploring the Qlik portal. It’s a great chance to see all the tools and resources we have to offer! Sign up here!Enjoy the holidays, rest well, and we look forward to supporting you and your students in the new year!
-
-
Update to the Automations Custom Code block version beginning January 31st 2026
We plan to update the Custom Code block in Qlik Automate to upgrade related software versions. When will this change go into effect? The update is exp... Show MoreWe plan to update the Custom Code block in Qlik Automate to upgrade related software versions.
When will this change go into effect?
The update is expected to begin rolling out on January 31st, 2026. We urge developers and automation users to review their Custom Code blocks for any possible compatibility issues before this date and to update them where necessary.
What exactly is changed?
The following software versions will be updated:
- PHP 8.3.20 upgraded to PHP 8.4 (Visit PHP docs)
- NodeJS 22 upgraded to NodeJS 24 (Visit NodeJS docs)
- Python 3.12 upgraded to Python 3.14 (Visit Python docs)
If you have any questions, we're happy to assist. Reply to this blog post or take similar queries to the Qlik Automate forum.
Thank you for choosing Qlik,
Qlik Support -
Qlik Open Lakehouse、ストリーミング対応、信頼性、オープン性、AI対応を強化(Qlik Blog 翻訳)
本ブログは "Supercharging Qlik Open Lakehouse: Now Streaming, Trusted, Open, and AI-Ready" の翻訳です。 著者:Vijay Raja 本年の AWS re:Invent 2025 において、Qlik Open Lake... Show More本ブログは "Supercharging Qlik Open Lakehouse: Now Streaming, Trusted, Open, and AI-Ready" の翻訳です。
著者:Vijay Raja
本年の AWS re:Invent 2025 において、Qlik Open Lakehouse の次世代機能を発表できたことを大変嬉しく思います。これは大きな飛躍であり、リアルタイムストリーミング取り込み、オンザフライ変換、組み込みのデータ品質とガバナンス、拡張されたエコシステム統合など、待望の機能を実現します。
このリリースにより、Qlik Open Lakehouse は AI、分析、オペレーショナルインテリジェンスのための完全な基盤へと進化します。これまでにない形で、オープン性、パフォーマンス、信頼性を統合します。
ストリーミング取り込み:リアルタイムデータを Iceberg に直接投入
AI 主導の現代において、リアルタイムデータはもはやオプションではなく、基盤となる要素です。
Qlik Open Lakehouse では、データベース、SaaS アプリケーション、SAP、メインフレームなど数百のソースからリアルタイム CDC データとバッチデータを、わずか数クリックで Iceberg テーブルに直接取り込むことが既に可能です。
この度、Apache Iceberg 向け高スループットストリーミング取り込み機能を発表します。これにより組織は、Apache Kafka、Amazon Kinesis、Amazon S3 などのストリーミングソースから毎秒数百万件のイベントを、データウェアハウスを介さずに Qlik Open Lakehouse 経由で直接 Iceberg テーブルに取り込めます。
これにより、Web およびモバイルアプリ、IoT デバイス、ログなどからペタバイト規模のリアルタイムデータを継続的に収集・クエリできるようになり、サイバーセキュリティ分析、IoT監視、予知保全、ライブ AI モデルトレーニングなどのユースケースを実現します。これらすべてを、オープンで柔軟性が高く相互運用可能なプラットフォームで実現します。
また、Qlik Open Lakehouse は設計上、コスト効率にも優れています。自動修復機能を備えたコスト効率の高い Amazon EC2 スポットインスタンスを活用し、取り込みコストを最大 70~90% 削減します。これにより数百万ドル規模のコスト削減が可能です。Qlik Open Lakehouse の取り込みコストとパフォーマンスを比較した最新ベンチマークをご覧ください。
さらに重要なのは、Qlik Open Lakehouse がスキーマの自動進化、ファイルの最適化、障害からの自動復旧を実行するため、ユーザーが手動で対応する必要がない点です。ネストされたスキーマを含む進化するスキーマに自動的に適応し、リアルタイムイベントの一貫性と信頼性の高い処理を保証します。
Amazon Kinesis から Iceberg へのストリーミング取り込みを実演する最新デモを、ここで一部ご紹介します。
https://videos.qlik.com/watch/G2MpJC2Bp3ZZXWivJhHVkS?
ストリーミング変換:データが流れると同時に整形
リアルタイム取り込みは始まりに過ぎません。ストリーミング変換により、複雑な手動バッチジョブを待ったり、データウェアハウスにロードしたりすることなく、データがレイクハウスに流入する過程で、そのデータをクレンジング、結合、再整形できるようになりました。
視覚的でノーコードのインターフェースを通じて、データチームはクリーニング、フィルタリング、標準化、ネスト解除、フラット化、マスキングなどの変換を定義できます。これらすべてがストリーム内で適用され、スキーマの進化は自動的に処理されます。
結果として、数時間や数日ではなく、数分で AI や分析に即対応可能なデータが得られます。
これにより、チームはデータ品質や鮮度の問題を、ソースに近い場所でリアルタイムに解決し、エンドユーザーに影響を与えることなく、データをキュレーション・整形できます。
さらに、Qlik のコスト最適化コンピューティングエンジン(EC2 スポットインスタンスベース)により、自動スケーリング、フェイルオーバー、信頼性を備えながら、従来手法の3分の1のコストでリアルタイム変換を実現します。
相互運用性をめざした設計により Iceberg エコシステムを拡張
Qlik Open Lakehouse はオープン性を追求して構築されています。今回のリリースにより、その相互運用性をさらに拡大します。
オープンレイクハウスアーキテクチャをさらに強力にする3つの主要なエコシステム統合をご紹介します。
- Snowflake Open Catalog のサポート – 現在利用可能な AWS Glue Catalog に加えSnowflake Open Catalog のサポートを追加します。これにより、お客様は Iceberg カタログの選択肢が広がり、環境をまたいだシームレスなデータ発見とガバナンスが可能になります。この統合により、拡大を続ける Iceberg エコシステムとの相互運用性が大幅に強化され、お客様は AWS ネイティブサービスか Snowflake のクラウドネイティブ環境のいずれにいても、モダンなレイクハウスを構築する自由を得られます。
- Databricks と Amazon Redshift へのゼロコピーミラーリング – Qlik は既に Snowflake へのゼロコピーミラーリングを実現しており、ユーザーはデータを複製することなく Snowflake で外部テーブルを作成し、クエリやダウンストリーム変換を実行できます。これによりパフォーマンスを維持しつつコストを削減します。今回、この強力な機能を Databricks および Amazon Redshift へのミラーリングにも拡大しました。これにより、チームは複数のプラットフォームにまたがる Iceberg データのクエリや変換を、データの複製やコスト増なしに実行できます。
- Apache Spark 統合の強化 – Apache Spark のサポートを強化し、あらゆる Spark ベースのエンジンが最新の Iceberg データに直接アクセスできるようにします。これにより、大規模な分析、AI、機械学習ワークロードを実現します。
これらの統合により、真にオープンで柔軟なマルチエンジン対応のレイクハウス環境を提供します。データチームはサイロ化を解消し、データの重複を最小限に抑え、インサイト獲得までの時間を短縮できます。
エンドツーエンドのデータ品質とガバナンス
オープンであることと、無秩序であることは同義語ではありません。Qlik Open Lakehouse により、Qlik Talend の信頼性の高いデータ品質とガバナンス機能を、Open Lakehouse および Iceberg 環境に直接統合します。
エンドツーエンドのデータリネージ、検証ルール、セマンティックタイプ、Qlik Trust Score といった Qlik の主要機能が利用可能となり、オープンレイクハウス内の全データセットの正確性、追跡可能性、AI 対応性を保証します。ユーザーは Iceberg テーブルやミラーリングされた Snowflake 環境を横断するデータの流れと変換を監視でき、データパイプラインに対する完全な可視性と信頼性を獲得できます。
大規模環境(Qlik の管理されたレイクハウス環境、データウェアハウス内部)においても、データ品質検証ルールは柔軟に実行可能で、最も重要な箇所で確実な保証を提供します。セマンティックタイプは多様なデータセット間で一貫した意味と文脈を確立し、企業全体での情報解釈方法を標準化します。
さらに Qlik Trust Score および Qlik Trust Score for AI により、Iceberg テーブル内のデータであっても、分析や機械学習に向けたデータ準備度の定量化が可能です。これにより、アクションの根拠となるインサイトの信頼性を確実に保証します。
Qlik Open Lakehouse は、開放性とガバナンスを両立と、信頼できるデータに基づいた革新の実現を可能にします。
Qlik Open Lakehouse の新たなベンチマーク
もちろん、これらが顧客にとって真のコスト削減と有意義なビジネス成果につながらなければ意味がありません。
これを検証するため、当社はベンチマーク調査を実施し、実際の顧客シナリオをシミュレートしながら、Qlik Open Lakehouse とクラウドデータウェアハウスのデータ取り込みコストとパフォーマンスを比較しました。
Qlik Open Lakehouse と Iceberg の組み合わせは、データウェアハウス管理の Iceberg ソリューションや同等の構成のネイティブデータウェアハウスと比較して、約77~89%のコスト削減とコンピューティング消費量削減を実現し、データ鮮度を2.5~5倍向上させることで、顧客に桁違いの価値を提供しました。ベンチマークテストの詳細と結果は Benchmarking Ingestion Costs and Performance of Qlik Open Lakehouse Vs a Data Warehouse でご確認いただけます。
なぜこれが重要なのか
現代の企業は、柔軟でオープンなアーキテクチャを活用し、AI とリアルタイムインサイトを実現する基盤を構築しています。しかし、その実現にはデータパイプライン、データ品質、ガバナンス、コスト効率の再考が不可欠です。
Qlik Open Lakehouse は、統一されたオープンかつガバナンスされた基盤を提供し、以下の機能を実現します。
- リアルタイムのデータのストリーム処理、変換、最適化
- AWS、Snowflake、Databricks などエコシステム間のシームレスな相互運用性
- データ取り込みのためのインフラストラクチャおよびコンピューティングコストを最大70~90% 削減
- 統制され信頼性が高い、分析のためのデータを大規模に提供
これが AI とデータ分析の未来のために構築されたオープンレイクハウスの次の進化形です。Qlik Open Lakehouse は、常にアクセス可能で相互運用性が高く、ロックインも妥協もない将来に備えたデータ環境を提供します。
一度構築すればどこでも活用可能——それがオープンレイクハウスアーキテクチャの真価です。
はじめましょう
Qlik Open Lakehouse は既に一般提供されています。この度、発表した主要な新機能は 2026年第1四半期に一般提供を開始し、拡張機能は 2026年前半にかけて順次提供されます。
Qlik が現代の企業向けに、オープンでリアルタイムかつ信頼性の高いデータで可能性を再定義する方法について詳しくご覧ください。
-
Introducing: Write Table now available in Qlik Cloud Analytics
Make your analytics apps interactive. Edit data, add comments, and watch your updates sync across sessions instantly. With Write Table’s instant sync... Show MoreMake your analytics apps interactive.
Edit data, add comments, and watch your updates sync across sessions instantly. With Write Table’s instant syncing and change tracking, teams can collaborate in real time and export updates through Qlik Automate.
Find it in the Chart Library when editing an app and get started!
Learn more here:
- Write Table | help.qlik.com
- Qlik Write Table FAQ
- SaaS in 60
- Write Table Product Tour
- Write Table now available in Qlik Cloud Analytics | Qlik Product Innovation Blog
Thank you for choosing Qlik,
Qlik Support