Unlock a world of possibilities! Login now and discover the exclusive benefits awaiting you.
Analytics & AI
Forums for Qlik Analytic solutions. Ask questions, join discussions, find solutions, and access documentation and resources.
Data Integration & Quality
Forums for Qlik Data Integration solutions. Ask questions, join discussions, find solutions, and access documentation and resources
Explore Qlik Gallery
Qlik Gallery is meant to encourage Qlikkies everywhere to share their progress – from a first Qlik app – to a favorite Qlik app – and everything in-between.
Qlik Community
Get started on Qlik Community, find How-To documents, and join general non-product related discussions.
Qlik Resources
Direct links to other resources within the Qlik ecosystem. We suggest you bookmark this page.
Qlik Academic Program
Qlik gives qualified university students, educators, and researchers free Qlik software and resources to prepare students for the data-driven workplace.
Recent Blog Posts
-
Qlik Stitch: HubSpot API deprecation and Connector Upgrade
As HubSpot plans to sunset the v1 contact lists API on September 30, 2025, any API requests using this version for contacts or lists endpoints will be... Show MoreAs HubSpot plans to sunset the v1 contact lists API on September 30, 2025, any API requests using this version for contacts or lists endpoints will begin to fail after that date. To ensure continuity, Qlik has released a new version, v4, of the connector.
The changes in questions are:
- Schema change, primary key, replication key change for contacts stream
- Schema change for contact_lists stream
What action do I need to take?
Upgrade to the new version. There are two ways to upgrade.
Upgrade and change the schema name
If you do not mind changing the schema name, you can do so by simply creating a new HubSpot integration and deleting the old one.
This is the recommended method. Creating a new integration with a different schema name means you will also benefit from a free historical re-sync of your data.
Upgrade using the same destination schema
If you prefer to reuse the same destination schema name:
- Pause the existing integration from their Stitch account.
- Wait for any records that are being prepared for loading to be loaded.
- Take note of the tables and fields tracked for replication, as well as the replication methods defined for these tables.
- Delete the existing integration from your Stitch account.
- Drop the schema from your destination data warehouse (or rename it if you'd like to continue working from this data as Stitch completes a new historical replication).
- Contact Qlik Stitch Support to coordinate a manual row-usage exemption for this connection.
- Configure a new integration with the same name, and Stitch will create this schema in your destination during the loading process.
If you have any questions, we're happy to assist. Contact us using chat or ask similar queries in the Qlik Stitch forum.
Thank you for choosing Qlik,
Qlik Support -
Qlik Custom Themes: Overview, Tips, and Tricks
Customizing your Qlik Sense apps not only enhances their visual appeal but also ensures consistency with your organization's branding guidelines. With... Show MoreCustomizing your Qlik Sense apps not only enhances their visual appeal but also ensures consistency with your organization's branding guidelines. With custom themes you can modify colors, fonts, and layouts on both global and granular levels, giving you complete control over the look and feel of your analytics.
In this blog post, we'll dive into the essentials of building a custom theme, dissect the anatomy of the theme's JSON file, and share some tips and tricks to help you create themes easily.
Bonus: along the way, we will be creating a Netflix inspired theme. We'll go from this:
to this:
Getting Started: The Essentials of Building a ThemeA custom theme in Qlik Sense is a collection of files stored in a folder.
It typically includes:
- Definition File (.qext): This file defines the theme's metadata, such as its name, description, type, and version.
{ "name": "Netflix Theme", "description": "A custom theme inspired by Netflix's branding.", "type": "theme", "version": "1.0.0", "author": "Ouadie Limouni" } - Main JSON File (.json): The core of your theme where you define styles, colors, fonts, and other visual properties.
- Optional Assets:
- CSS Files: For additional styling that can't be achieved through the JSON file alone.
- Font Files: Custom fonts to enhance typography.
- Images: Logos or background images to incorporate into your theme.
Folder structure example:
netflix-theme/
├── netflix-theme.qext
├── theme.json
├── netflix.css (optional)
├── BebasNeue-Regular.ttf (optional)
└── images/ (optional)
    └── background.jpg
Anatomy of the `theme.json` File
(The full theme code is attached at the end of this blog post)- Variables Section (_variables)
Variables allow you to define reusable values (like colors and font sizes) that can be referenced throughout your theme. Variables must be prefixed with `@`.
Example:"_variables": { "@primaryColor": "#E50914", "@backgroundColor": "#141414", "@ObjectBackgroundColor": "#3A3A3A", "@fontColor": "#FFFFFF", "@secondaryColor": "#B81D24", "@fontFamily": "\"Bebas Neue\", Arial, sans-serif", "@fontSize": "14px" } - Global Properties
These properties set the default styles for your entire app.
- Color: Sets the default font color.
- Font Size: Sets the default font size.
- Font Family: Sets the default font family.
- Background Color: Sets the default background color for visualizations.
- Sheet Styling
Customize the appearance of sheets, including the title backgrounds.
- Object Styling
Control the styling of various objects (charts, tables, etc.) in your app.
- Data Colors
Define how data appears in your visualizations, including primary data color, colors for null values, and colors for different selection states.
Learn more here. - Palettes and Scales
Palettes are arrays of colors used for dimensions (categorical data). You can define custom palettes for data and UI elements.
    "palettes": {
      "data": [
        {
          "name": "Netflix Data Palette",
          "scale": [
            "#E50914",
            "#B81D24",
            "#221F1F",
            "#FFFFFF"
          ]
        }
      ],
      "ui": [
        {
          "name": "Netflix UI Palette",
          "colors": [
            "#FFFFFF",
            "#B3B3B3",
            "#333333",
            "#000000"
          ]
        }
      ]
    },
Scales are used for measures (numerical data) and can be gradients or classes.
"scales": [ { "name": "Netflix Red Gradient", "type": "gradient", "scale": ["#B81D24", "#E50914"] }, { "name": "Netflix Grey Gradient", "type": "gradient", "scale": ["#333333", "#B3B3B3"] } ], - Custom Fonts and Styles
To achieve the Netflix-style typography, we can use a font similar to Netflix's branding.
For this example, we'll use "Bebas Neue", a free font that's close in style. - Extended Object Styling
You can apply specific styles to individual chart types, overriding global settings.
Example for a Bar Chart:
      "barChart": {
        "label": {
          "value": {
            "color": "@fontColor",
            "fontSize": "12px",
            "fontFamily": "@fontFamily"
          }
        },
        "bar": {
          "fill": "@primaryColor"
        },
        "outOfRange": {
          "color": "#404040"
        }
      },
Tips and Tricks
Creating custom themes can be a rewarding experience, and here are some tips to help you along the way:
1. Use Variables for Consistency
Defining colors, font sizes, and other reusable values as variables ensures consistency across your theme and makes updates easier.
"_variables": {
  "@primaryColor": "#E50914",
  "@fontSize": "14px"
}
2. Leverage Inheritance
The `_inherit` property allows your theme to inherit properties from the default theme, reducing the amount of code you need to write.
{
  "_inherit": true,
  // Your custom properties here
}
3. Test Incrementally
Apply your theme during development and test changes incrementally. This approach helps you catch errors early and see the immediate impact of your changes.
4. Organize Your Theme File
Keep your `theme.json` file organized by grouping related properties. This practice makes it easier to navigate and maintain your theme.
5. Prefix Your Variables and Themes
To avoid conflicts with other themes or variables, use unique prefixes.
"_variables": {
  "@netflix-primaryColor": "#E50914",
}
6. Validate Your JSON Files
Always validate your JSON files to prevent syntax errors. Use online tools like JSONLint.
7. Utilize Custom Fonts Carefully
Don't overuse custom fonts and ensure that any custom fonts you use are properly licensed for use in your application.
8. Use High-Quality Images
If you're incorporating images (like backgrounds or logos), make sure they are high-quality and optimized for web use.
-> Stay up-to-date with the latest on qlik.devApplying the Netflix Theme to Your App
Once you've created your custom theme, you can apply it to your Qlik Sense app:
1. Upload the Theme: Upload the zipped folder to the Themes section in your Console.
2. Apply the Theme: In your app, go to the App options menu, select Appearance, and choose your custom theme from the list.📌 If you are an advanced developer, checkout the following blog posts that tackle theming in an embedded context:
- Theming with Picasso.js
- Qlik Embed (theming section towards the end)Happy theming!
- Definition File (.qext): This file defines the theme's metadata, such as its name, description, type, and version.
-
Qlik の無料トライアルが新しくなりました!パワフルな機能と直感的な操作性をお試しください
Qlik Talend Cloud® は14日間、Qlik Cloud Analytics は30日間無料でお試しいただけます。「実際の操作感を確かめてみたい」「導入前に自社データで試してみたい」など、実際の環境をご体験いただけます。Qlik 製品のパワフルな機能と直感的な操作性を、今すぐ無料でお試... Show MoreQlik Talend Cloud® は14日間、Qlik Cloud Analytics は30日間無料でお試しいただけます。「実際の操作感を確かめてみたい」「導入前に自社データで試してみたい」など、実際の環境をご体験いただけます。Qlik 製品のパワフルな機能と直感的な操作性を、今すぐ無料でお試しください。
クリックテック・ジャパンの技術部門が解説しているハンズオン Web セミナーも併せてご参考ください。
Qlik Analytics | Qlik Sense 入門 ハンズオン Web セミナーQlik Cloud Analytics | Qlik Sense アプリ開発ベーシックトレーニング
Qlik Analytics | Qlik Sense データ分析の魅力を底上げ!映えるダッシュボード作成術
-
Audit Events Not Tracked After Fresh Installation of NPrinting (February 2025 SR...
Description of the Issue We have identified a degradation in the event auditing functionality in NPrinting, tracked in QCB-32819. Specifically, audit ... Show MoreDescription of the Issue
We have identified a degradation in the event auditing functionality in NPrinting, tracked in QCB-32819. Specifically, audit events are not being tracked after a fresh installation of the following versions:
- February 2025 SR2
- February 2024 SR6
It is important to note that this issue only occurs with new installations of these versions. If the system is upgraded from a previous version, the problem does not manifest.
Effects Observed
- Audit events are not being tracked.
- The following API endpoints fail with the error:
- api/v1/audit/logs
- api/v1/audit/events
500 Internal Server Error : An unhandled exception occurred; check the log for more information.- The log file located at %ProgramData%\NPrinting\Logs\nprinting_audit.log shows this error message:
Unable to start Audit service. ERROR: System.AggregateException: One or more errors occurred. ---> System.InvalidOperationException: Could not export the testing database. ---> Npgsql.PostgresException: 42501: permission denied for schema publicWorkaround
In addition to performing an upgrade from a previous version instead of a fresh installation, the following steps can be taken to work around the issue:
1. Stop all NPrinting Server services except QlikNPrintingRepoService (otherwise PGAdmin will not find the connection to the DB).
2. Download and install PGAdmin, and connect to the NPrinting Server database.
3. Navigate to the nprinting_audit database and execute the following command:
GRANT ALL PRIVILEGES ON SCHEMA public TO nprinting_audit;4. Run the following command as administrator:
net start QlikNPrintingAuditService /setup5. Start all NPrinting server services.
This will allow the audit service to start correctly and resume tracking audit events.
-
Qlik Security Advisory: Salesloft and Drift
Salesforce recently identified a security incident involving the Drift app (published by Salesloft). For additional details, see Security Advisory: Un... Show MoreSalesforce recently identified a security incident involving the Drift app (published by Salesloft). For additional details, see Security Advisory: Unusual Activity in a Third Party Connected App | status.salesforce.com.
Are Qlik customers affected by the security vulnerability?
Qlik does not use the Salesloft Drift application. Although Qlik uses the Salesloft platform, Salesloft has stated there is no evidence of any unusual or malicious activity with the Salesloft platform.
Is Qlik monitoring the situation?
Yes. We are monitoring the situation closely, where the privacy and security of your data are our highest priority.
To stay up to date, review the Salesforce Informational Message ID 20000217: Security Advisory: Unusual Activity in a Third Party Connected App | status.salesforce.com.
Thank you for choosing Qlik,
Qlik Support -
【オンデマンド配信】製薬業界向けサイロ化したデータの高度活用について
製薬業界が抱える「データのサイロ化」課題に対し、Qlik による統合情報基盤の構築と高度活用をご提案します。創薬から市販後調査までの業務改善を支援し、AI や自動化によるデータドリブン経営を実現します。 ※ パソコン・タブレット・スマートフォンで、どこからでもご視聴いただけます。今すぐ視聴する 今... Show More -
Join Our Next Learning Experience
What is a Learning Experience? A Learning Experience is a live, one-time, instructor-led session created exclusively for Passport holders. You tell u... Show MoreWhat is a Learning Experience?
A Learning Experience is a live, one-time, instructor-led session created exclusively for Passport holders.
You tell us what you need to learn now, and our instructors design a focused class to help. These sessions often cover:
- Topics not included in the standard catalog
- Areas that need extra depth
- The latest product updates
The goal is simple: fresh, useful knowledge you can apply right away.
Upcoming Learning Experiences:
- Oct: Qlik Cloud Reporting
- Nov: Qlik Answers Deep Dive
- Dec: Resolving Common Modeling Issues
Don’t miss out—get your Passport today and unlock all instructor-led courses plus exclusive Learning Experiences designed for your growth.

-
Custom Report Extension
A couple of years ago I wrote a blog on customizing straight tables in QlikView explaining how you can add an ad-hoc report to your QlikView app. So,... Show MoreA couple of years ago I wrote a blog on customizing straight tables in QlikView explaining how you can add an ad-hoc report to your QlikView app. So, I thought I would share how you can now create a custom report in Qlik Sense using the Climber Custom Report extension. The Climber Custom Report is an extension that can be added to your Qlik Sense app to give users the ability to create their own ad-hoc reports. In this blog, I will show you how easy it is to add a custom report to your app using Qlik Sense Desktop.
- The first step is to download the Climber Custom Report extension from Qlik Branch, unzip it and put it in your Extensions folder (C:\Users\xxx\Documents\Qlik\Sense\Extensions).
- In your Qlik Sense app, create a table with all the possible dimensions and measures a user may want to see in a report and then add the table to master items. The table may look something like this:

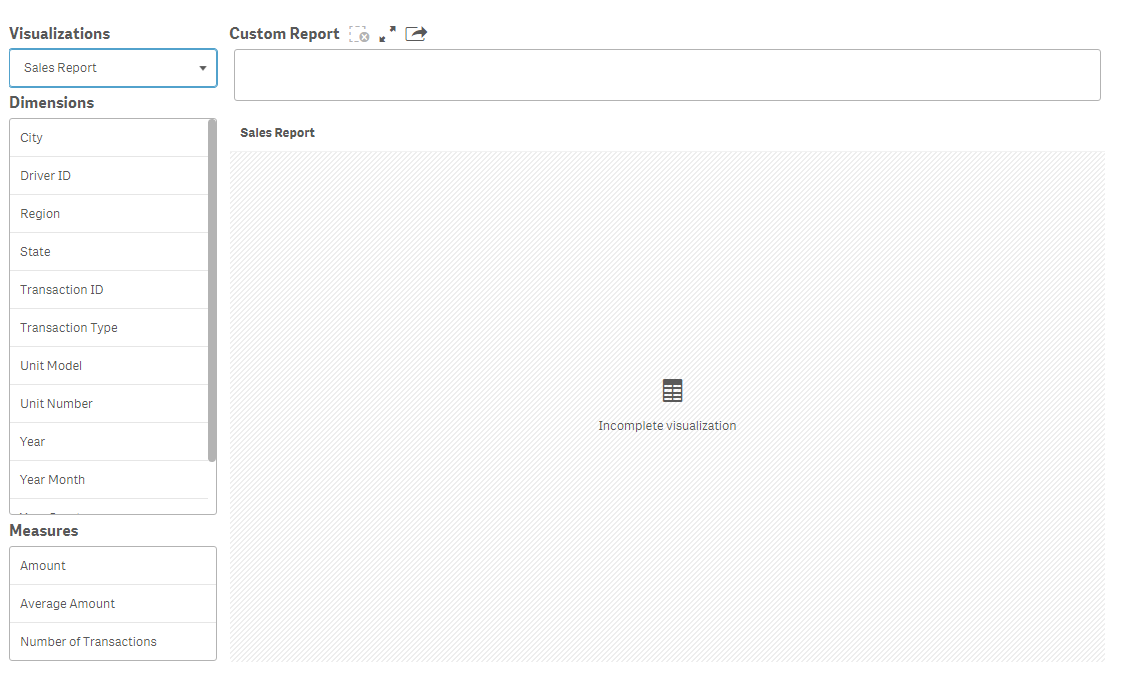
- Add the Climber Custom Report extension to a sheet in your app and then you are ready to create a report.
- In the Visualizations drop down, select the report you just created. All tables that are in your visualization master items will be listed in the drop down. Once the table is selected, the dimension and measure lists will be populated with the dimensions and measures that are used in the table as seen below.
- Select the dimensions and measures you would like to add to your report by clicking on them. Your report will look something like the image below after you make some selections. The dimensions are blue and the measures are orange.
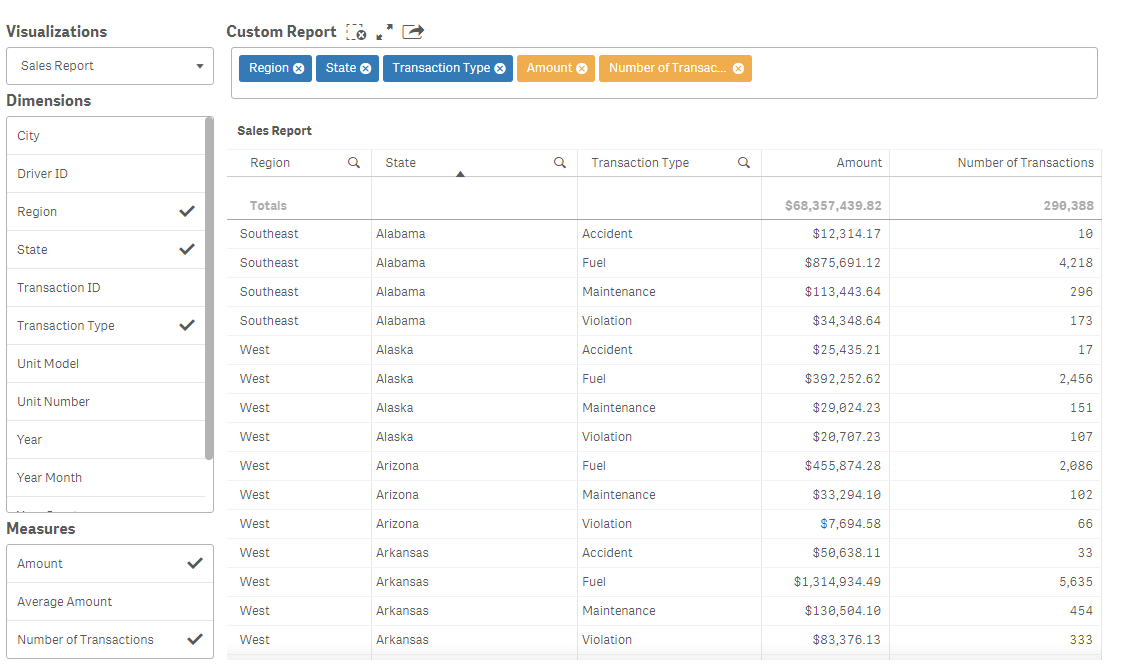
- From the custom report bar above the chart, you can remove a dimension or measure by clicking the x and you can change the order of the columns by dragging and dropping the dimensions and measures into the order you would like them to appear in the report.
And that is it - it is that simple to add a custom report to your Qlik Sense app. With Qlik Sense self-service, a user can create a report by dragging and dropping dimensions and measures into a table but what I like about the Climber Custom Report extension is it makes everything available to the user with a clean, professional and organized look. Download it now and test it out for yourself. See the extension in action in the Situational Awareness demo. Note - the Climber Custom Report extension works in Qlik Sense 3.0 and higher and, like all extensions, are not supported by Qlik.
Thanks,
Jennell
-
FROM_FIELD() - Is very powerful! It helped me parse JSON data stored in a field!
This is a simple example that works with flat json, meaning non-nested json hierarchies. However, you can use a combination of other functions like J... Show MoreThis is a simple example that works with flat json, meaning non-nested json hierarchies. However, you can use a combination of other functions like JSONGET() and JSONSET() to extract needed data. More examples on this to follow.
Playlist: https://www.youtube.com/playlist?list=PLW1uf5CQ_gSqF5bcmbBrk1q7Q4-h899V1
Qlik Help:

-
Techspert Talks - Qlik Cloud Admin 201
Hi everyone, Want to stay a step ahead of important Qlik support issues? Then sign up for our monthly webinar series where you can get first-hand insi... Show MoreHi everyone,
Want to stay a step ahead of important Qlik support issues? Then sign up for our monthly webinar series where you can get first-hand insights from Qlik experts.
Our most recent Techspert Talks session was Qlik Cloud Admin 201.But wait, what is it exactly?
Techspert Talks is a free webinar held on a monthly basis, where you can hear directly from Qlik Techsperts on topics that are relevant to Customers and Partners today.In this session we will cover:
- Troubleshooting entitlement allocation
- Exploring Capacity Consumption
- Leveraging Qlik APIs for User Management

-
【オンデマンド配信】食品製造業界向けサイロ化したデータの高度活用について
食品製造業界では、部門間のデータ分断や非構造化データの活用不足が大きな課題となっています。Qlik の統合情報基盤と AI 活用により、現場から経営までをつなぐ高度なデータ活用を実現する方法をご紹介します。 ※ パソコン・タブレット・スマートフォンで、どこからでもご視聴いただけます。今すぐ視聴する ... Show More -
A Fresh Take on Qlik Community Navigation
Fall is on the horizon, and we’re bringing you some fresh new updates on the Community! Our September refresh is all about making navigation smoother,... Show MoreFall is on the horizon, and we’re bringing you some fresh new updates on the Community! Our September refresh is all about making navigation smoother, faster, and more intuitive, here’s what’s new:
We’re always looking for ways to make the Qlik Community easier to explore and more enjoyable to use. Over the past couple of weeks, we’ve been hard at work refreshing our navigation and page layouts, streamlining menus and breadcrumbs to help you move around more easily.
We’ve refined key areas across the Community so navigation feels cleaner, faster, and more intuitive. Pages are now better organized, with improved grouping of programs and events, and subtle UX enhancements to help you orient yourself as you navigate.
We’ll continue to refine these updates over time and would love to hear from you! If you discover something you really love, or have ideas for what we should tackle next, don’t hesitate to let us know in the comments below! We’ll be back soon with more updates.
Your Qlik Community Managers,
Melissa, Sue, Jamie, Nicole, Tammy, Caleb and Brett
@Melissa_Potvin @Sue_Macaluso @Jamie_Gregory @nicole_ulloa @Tammy_Milsom @Brett_Cunningham
-
Dynamic Zone Visibility
Dynamic Zone Visibility Lupus Analytics Dynamic Selections Discoveries How to dynamically switch between charts Dynamic Zone post I... Show More
Dynamic Zone VisibilityLupus Analytics Dynamic Selections
Discoveries
How to dynamically switch between charts Dynamic Zone post
Impact
Small space, bigger impact on user engagement
Audience
All users
Data and advanced analytics
Recipe:
1. Layout Container
2. Three Buttons
3. Line Chart, map and two bar charts
4. Add your data, mix with variable and good color pallet.
5. Style with Inter, sans-sarif. -
Are You Ready to Become a Qlik Academic Program Educator Ambassador?
The Qlik Academic Program provides educators, students, and researchers from accredited universities with free Qlik software and learning resources to... Show MoreThe Qlik Academic Program provides educators, students, and researchers from accredited universities with free Qlik software and learning resources to educate and train the next generation of experts leading with data. Our Educator Ambassador Program aims to shine the spotlight on our most active educator members. Our ambassadors will champion our vision to make more students data literate and to prepare them for the data-driven workplace.
Are you a current educator member who is:
- Passionate about the Qlik Academic Program and all of the program resources
- Dedicated to preparing students for the data-driven workplace
- An active promotor of the Qlik Academic Program to academic peers as well as students
- Willing to share your experience of the Qlik Academic Program at (virtual) events, in forums, on social media, and in the press
- A contributor to blogs, forums, university publications, professional journals, papers, or other materials that promote the Qlik Academic Program
If you answered YES to one or more of the above, then we encourage you to apply to the Educator Ambassador Program! Learn more and apply now!
All current educator members are eligible to apply. If you have not already signed up for the Qlik Academic Program, you can do so at https://www.qlik.com/us/academicprogram and then check out our current 2025 Educator Ambassadors.
Application Deadline: The application deadline is November 14 , 2025, and the new class of ambassadors will be announced in early 2025.
Ambassador Benefits:
If you are selected as a Qlik Academic Program Educator Ambassador, you will receive a host of benefits including:
- Insight: Exclusive webinars with Qlik leaders, customers, and partners covering the latest trends in analytics and other industry topics
- Credibility: A digital badge to certify ambassador status and a featured online profile
- Exposure: Outreach opportunities to showcase your experience with the Qlik Academic Program via Qlik marketing channels or speaking engagements
- Perks: Discounts on Qlik events and other exclusive rewards
- Community: Network and collaborate with other educators across various fields and geographies
- Opportunity: Potential to advance your career, including meeting university requirements for scholarly contribution beyond the classroom
Apply to become an Educator Ambassador today!
-
Welcome to the Qlik Digest!
This was created thanks to requests from some of our top customers, looking to share the best of Qlik with everyone at the organisation. Regular conte... Show MoreThis was created thanks to requests from some of our top customers, looking to share the best of Qlik with everyone at the organisation. Regular content includes:
- The latest Qlik product updates.
- Useful resources including new training materials, and tips on getting the most from your data.
- Hot events and webinars for you to attend.
- Customer stories and a spotlight to introduce you to other Qlikkies.
- A monthly flash poll to let us know your thoughts on a range of topics.
We want all Qlik users to get access so please share with your colleagues and encourage them to subscribe to the mailing list or to the Qlik Digest Blog on Qlik Community.
If you have any feedback we would love to hear from you. Please comment below or send an email to lucy.bannister@qlik.com
Happy Reading!
-
Cosmos Saint Seiya Container Data Sheet
Cosmos Saint Seiya Container Data Sheet RCD - Department Business Analytics This app was created with the purpose of being able to show the use ... Show MoreCosmos Saint Seiya Container Data SheetRCD - Department Business AnalyticsThis app was created with the purpose of being able to show the use of the container together with the use of buttons, graphics and video extension, this allows exploring the data and being able to tell a visual story and enrich the information. For this app, the Saint Seiya animation was used as a reference. ¡ And who says data stories can't be told in a fun way while also providing learning and practice on topics we love !Discoveries
Use and practice of the container and visual part with transposed buttons and graphics
Impact
Use this practice to learn more about the container's functionality in a fun and dynamic way and then be able to apply it in official and formal projects that require a visual environment with this approach.
Audience
Team members to explore the container's functionalities
Data and advanced analytics
Practice of transposed objects with the purpose of implementing it in formal projects
-
Qlik Cloud 8月の新機能
Qlik Cloud の新機能 Qlik Cloud Learning 従来の 「Getting started」 が「Learn(学習)」ページに置き換わりました。ステップバイステップの成果重視型学習パスを提供します。 SAML ベースの IdP が暗号化されたアサーションをサポート Qli... Show MoreQlik Cloud の新機能
Qlik Cloud Learning
従来の 「Getting started」 が「Learn(学習)」ページに置き換わりました。ステップバイステップの成果重視型学習パスを提供します。
SAML ベースの IdP が暗号化されたアサーションをサポート
Qlik Cloud は、プラットフォームと互換性のあるすべての SAML ID プロバイダーのアサーション署名の検証と復号をサポートするようになりました。SAMLアイデンティティプロバイダーでは、アサーション(ユーザーの認証情報や属性情報、権限などを記述したXMLドキュメント)を使用してユーザーの認証と承認を行います。
これらのアサーションは、信頼性を検証するために署名され、内容を保護するために暗号化されます。Qlik Cloud は、プラットフォームと互換性のあるすべての SAML ID プロバイダーのトークン署名の検証と復号をサポートしています。
詳細については、下記を参照してください。
署名および暗号化された ID アサーション (SAML) のキー ペアの管理
データ接続管理(新しいセキュリティスコープ)
Qlik Cloud では、管理者がデータ接続の作成、管理、または読み取りのみを行える権限を誰に付与するかを完全に制御できるようになりました。この新しいセキュリティスコープは、スペースの枠を超えたエンタープライズグレードのガバナンスを提供し、テナント全体にわたる一貫した適用を保証します。
- Global Control - テナント全体でデータ接続を作成または読み取ることができるユーザーを定義します。
- Governance Beyond Spaces – スペース レベルの権限に加えてグローバルな適用を追加します。
- Stronger Restrictions – スペース エディターや PACC(Private Analytics Content Creator) ユーザーであっても、接続を作成するには明示的な割り当てが必要です。
この待望の機能強化により、データ ガバナンス、セキュリティ、プライバシー、コンプライアンスが強化されるとともに、組織が求めていた精度が実現します。
詳細は、こちらを参照してください。
分析の新機能
OpenAI Connector で新しい 生成AIモデルのサポート
Open AI Connector で下記のモデルをサポートしています。
- GPT 5
- GPT 5 mini
- GPT 5 nano
新しい GenAI 分析コネクタ
次の新しい GenAI 分析コネクタが追加されました。
- Amazon Bedrock – Converse API は、Converse API を通じてアクセスできるすべての生成テキスト モデルに対してユニバーサル サポートを提供します。ガードレールのサポートも利用できます。
- Google AI – Gemini は、Gemini などの Google AI テキスト生成モデルのサポートを追加します。
詳細はこちらを参照してください。
Amazon Bedrock - Converse API 分析ソース
Windowスクリプト関数の強化
- 指定されたソート式で順序付けされたデータに対する集計処理をサポートし、デフォルトのロード順序に依存せずソート済みスライディングウィンドウを実現
- オプションパラメータの処理に関するドキュメントの明確化と動作の改善
- WRank関数が他の式内にネストされた際に不正な値を返す問題を修正
テーブルレシピ
- シンプルな単一テーブルのデータ準備のための、使い慣れたスプレッドシートのようなインターフェース
- データクレンジング、標準化、変換、分割、マスキング、フォーマットのための 60 以上のノーコード関数
- 列のプロファイリングとフィルタリングが組み込まれており、データをすばやく検査、調査、調整
- 柔軟な使用オプション:
⁻スタンドアロンテーブルレシピ : レシピをカタログアセットとして作成し、1つのソースから1つのターゲットにステップを適用し、出力を実行またはスケジュールします。単一ソースから単一ターゲットへのシンプルなユースケースに最適です。
⁻データ フローに埋め込まれる : テーブル レシピを、中間または混合ユース ケースの大規模なデータ フロー内のプロセッサとして使用し、複数のソース、ターゲット、またはより複雑なプロセッサを同じフロー内で組み合わせます。
詳細は、こちらを参照してください。
データ統合の新機能
スケジュールされた CDC タスクの拡張モニタリング
スケジュールが実行されなかった場合に警告を出すために、データ タスク モニターには、スケジュールされた CDC タスクに関する次の情報が表示されるようになりました。
- スケジュール:スケジュール間隔
- スケジュール未実行からの経過時間:前回のスケジュール実行からの経過時間。スケジュール通りに実行が開始されなかった場合、未実行のスケジュール数と共に警告が表示されます。
以下の場合、スケジュールされたCDCタスクが実行できない場合があります。
- ソースに多数の変更があったため、前回のタスクは次回のスケジュールされた実行までに完了しない
- データ ソースまたはターゲットへの接続を妨げるネットワークの問題
- ターゲットにアクセスするための Data Movement gateway (VPC 内にある場合)
詳細はこちらを参照してください。
検証ルールの強化
Qlik Talend Cloudは、is of typeオペレーターを検証ルール定義でサポートしています。この機能強化により、ユーザーはフィールドの内容が特定のセマンティックタイプと一致するかどうかを確認できます。利用可能なセマンティックタイプは、データ統合アクティビティセンターの「データ品質セクション」内の「セマンティックタイプ管理」タブで設定された組み込みタイプとユーザー定義タイプの両方に依存します。
詳細はこちらを参照してください。
プレビューデータに列データ型の表示
SQL 変換をプレビューすると、結果に列のデータ型が含まれるようになりました。データ移動ゲートウェイを使用してデータ ソースにアクセスする場合、この機能にはバージョン 2024.11.70 以降が必要です。
テーブルエラー処理のトリガータイミングの制御
レプリケーションタスクとランディングタスクのテーブルエラー処理設定に、テーブルエラーを返すまでの再試行回数という新しい設定が追加されました。

-
Growing engagement with Singapore Universities and Polytechnics
Singapore is an important center of business and economy in Asia and particularly, in the ASEAN region. Many educational institutions continue to flou... Show MoreSingapore is an important center of business and economy in Asia and particularly, in the ASEAN region. Many educational institutions continue to flourish and provide world class education here. Some of the top Universities in the world are located in Singapore. In addition, the Polytechnics provide vocational and skill based education to students.
The Qlik Academic Program has been engaged with many Universities and Polytechnics in Singapore in an effort to provide quality data analytics training, qualifications and certifications.
With Republic Polytechnic, for the Diploma in Business Analytics students , a talk was organized led by our Technical Expert, Kam Wei Leong. The title of the talk was “Agentic AI: Real Value, Right Now” where he spoke about the evolution from descriptive analytics to GenAI and Agentic AI. Also, he shared the key building blocks of Agentic AI and Qlik's perspective on how such technology can actually be of value to users in their respective roles and to their organisation. Kam Wei also shared how to build end-to-end AI applications in Qlik Cloud.
Republic Polytechnic's Professor Ho Chee-wai is also an Educator Ambassador for the Qlik Academic Program's batch of 2025 and he is going to be on a panel discussion during Qlik's flagship event, AI Reality Tour on October 1st.
With Institute of Technical Education ( ITE), Qlik is a partner for the "ITE Digitalisation & Sustainability Challenge 2025" in November. Along with the support for this event in the form of prizes, students and professors are also leveraging the benefits of the Qlik Academic Program. Recently, a workshop to explain the benefits of Qlik Sense and help them build dashboards and visualisations was organised. ITE is also hosting a session for their students in October, where Qlik Chief Marketing Officer, Chris Powell is planning to address them.
National University of Singapore ( NUS) has been one of the stronger partners of the Qlik Academic Program. Students of the MBA in Business Analytics course have been gaining from the program every year. We have conducted various sessions for students to get familiar with Qlik Sense and how they could solve business problems using the software.
We continue to grow in Singapore and expand the academic program offerings to students and professors. If you would like to know more about the academic program, please visit: qlik.com/academicprogram
-
How to Handle Custom CSS in Qlik Sense (Now and Going Forward)
Custom CSS has been a popular workaround in Qlik Sense for years, helping developers tweak layouts, hide buttons, and get around styling limitations. ... Show MoreCustom CSS has been a popular workaround in Qlik Sense for years, helping developers tweak layouts, hide buttons, and get around styling limitations. But things are shifting. With the Multi-KPI object being deprecated and native styling options getting stronger with every release, it’s a good time to rethink how we approach custom styling in Qlik Sense moving forward.
In this post, we’ll break down:
- Why custom CSS is used in Qlik Sense
- What’s changing (and why Multi-KPI is being deprecated)
- Best practices for styling moving forward
- Alternatives for injecting CSS when needed
- What you can (and should) do now to future-proof your apps
Let’s dive in!
Why is custom CSS used in Qlik Sense?
In the past, Qlik’s built-in styling options were limited. That led to many developers using CSS to:
- Hide toolbars, buttons, and headers
- Apply custom fonts or background gradients
- Create grouped layouts or dashboards with unique branding
Most of this was made possible by either creating custom themes, building extensions, or using the Multi-KPI object as a helper to inject CSS code. But as powerful as these techniques were, they also came with downsides, like breakage after updates or difficulty governing app behavior at scale.
So, What’s Changing?
The biggest shift is the deprecation of the Multi-KPI object, which has served as a popular CSS injection tool. Here's what you need to know:
EOL of the Multi-KPI object is May 2026:
- Existing dashboards will still work for now, but migration is highly encouraged.
- The object is deprecated due to governance challenges and unintended side effects from injected CSS.
If you’ve been using the Multi-KPI as a styling workaround, it’s time to plan for alternatives.
Native Styling Has Come a Long Way
Before reaching for CSS, it's worth exploring what Qlik now offers natively. Many of the styling tweaks that once required CSS are now fully supported in the product UI.
Here’s a quick look at recent additions:
Native styling available now or coming in the next update
Straight Table
Background images, word wrap, mini charts, zebra striping, null styling, header toggle
Pivot Table
Indentation mode, expand/collapse, RTL support, cyclic dimensions
Text Object
Bullet lists, hover toggle, border control, support for up to 100 measures
Line Chart
Point and line annotations
Scatter Plot
Reference lines with slope, customizable outline color and width
Layout Container
Object resizing and custom tooltips
Navigation Menu
Sheet title expressions, left/right panel toggle, divider control
And this list keeps growing. If you're building new apps or redesigning old ones, these built-in features will cover a huge percentage of use cases.Many deprecated CSS tricks are now native. Check out the full Obsolete CSS Modifications post for examples and native replacements.
What About Themes?
Themes are not going anywhere. In fact, they remain the most robust and supported way to apply consistent styling across your app portfolio.
With custom themes, you can:
- Define global font families, sizes, and colors
- Style specific object types like bar charts, pie charts, list boxes, and even treemaps
- Customize titles, footers, legends, and more via the JSON schema
- Apply branding at scale without touching each sheet manually
You can still include CSS files in themes, but remember:
- Inline styles used by Qlik objects may require the use of "!important" to override.
- Themes are not ideal for object-ID-specific or user-interactive CSS injection.
If you're new to themes, Qlik.dev has a great guide to get started, or checkout my previous blog post for some tips and tricks.
Still Need Custom CSS? Here’s What You Can Do
If your use case goes beyond what native styling or themes can handle—like hiding a specific button, or styling based on object IDs—you still have a few options:
- Extensions (with scoped CSS)
Prefix styles with .qv-object-[extension-name] to isolate your rules.
Load styles using RequireJS or inject via <style> in JS.? - Mashups
Full control over styling via your own HTML + CSS + JavaScript.
Ideal for web apps embedding Qlik charts via qlik-embed
What's Missing
A lot of Qlik users have voiced the same thing: "we still need an officially supported way to inject CSS at the sheet or app level"
Some have suggested:
- A new “Advanced Styling” section in sheet properties.
- A standalone helper object just for advanced styling (like Multi-KPI but cleaner).
- Ability to define per-object-type styling rules in themes (e.g. “all straight tables”).
Qlik has acknowledged this feedback and hinted that future solutions are being considered.
What You Should Do Today
- Use native styling wherever possible—it's safer, easier to maintain, and now way more powerful
- Migrate away from Multi-KPI if you’ve been using it to inject CSS
- Explore themes for app-wide branding and consistent object styling
- Use extensions or mashups for truly custom experiences
- Follow community updates for new announcements around styling capabilities
That’s a wrap on this post. With more native styling features on the way, I’ll be keeping an eye out and will be likely sharing a follow-up as things evolve. If you're in the middle of refactoring or exploring new approaches, stay tuned, there’s more to come.
-
Table Recipe now in Qlik Cloud Analytics
Clean, prep, and go. It’s that simple. It’s here! Your new go-to for quick no-code data preparation in Qlik Cloud Analytics. Table Recipe makes it ... Show MoreClean, prep, and go. It’s that simple.
It’s here! Your new go-to for quick no-code data preparation in Qlik Cloud Analytics. Table Recipe makes it easy for anyone to clean single-table datasets fast and keep your insights flowing.
Just pick your dataset, build your step-by-step recipe, and see your results instantly.
See it in action for yourself! Check out this awesome walkthrough of Table Recipe by @igoralcantara, showing exactly how it works.
Fast, Visual Data Prep
Clean up your data with over 60 built-in functions, from formatting and masking to calculating new columns. All in an interactive spreadsheet-like interface where you can apply changes and view the outcome right away.
Each step you take becomes part of a recipe tracked on the right-side panel. Easy to repeat. Easy to share.
Designed for Everyone
Table Recipe is made for Qlik users who want to prep data without writing script. Whether you're new to data prep or just need to clean up a dataset quickly, it's built to keep things simple and clear.
“Table Recipe gives non-technical users the ability to create datasets on their own, which is essential as companies scale to 100,000 users.”
— Alessandro Furtado, Principal Consultant, Farol Data AnalyticsPrep that Fits into Your Workflow
Fully integrated into Qlik Cloud Analytics, you can use Table Recipe on its own for quick, one-off table prep, or embed it into larger Data Flow workflows to combine and shape multiple data sources. As you build your recipe, it automatically generates Qlik Script behind the scenes, giving you the power of scripting without complexity. Easily collaborate in shared spaces, track changes in Activity Center, and send your cleaned data directly into dashboards, apps, ML or AI models.
Key Highlights
- Spreadsheet-style, no-code interface
- 60+ data prep functions for cleansing, standardizing, converting, splitting, masking, and formatting data
- Built-in column profiling and filtering to easily explore and inspect data
- Instant visual feedback
- Full integration within Qlik Cloud Analytics (apps, scripts, Data Flows, Activity Center, shared spaces)
- Included with all Qlik Cloud Analytics editions
Learn More
- Loading and preparing data with table recipe | Qlik Help
- Table Recipe Product Tour
- What’s New in Qlik Cloud | Qlik Help
- Data Preparation Webpage