Unlock a world of possibilities! Login now and discover the exclusive benefits awaiting you.

- Qlik Community
- :
- Discover
- :
- Qlik Community
- :
- Water Cooler
- :
- Re: Qlikview Creating Time Line Chart
- Subscribe to RSS Feed
- Mark Topic as New
- Mark Topic as Read
- Float this Topic for Current User
- Bookmark
- Subscribe
- Mute
- Printer Friendly Page

 s10157754
- Mark as New
- Bookmark
- Subscribe
- Mute
- Subscribe to RSS Feed
- Permalink
- Report Inappropriate Content
Qlikview Creating Time Line Chart
Dear Qlikview Experts,
I have this set of data.

First Column is the Date & Time and second column is the value either '1' or '0'. I would like to create a time line chart to display the data similar like below:
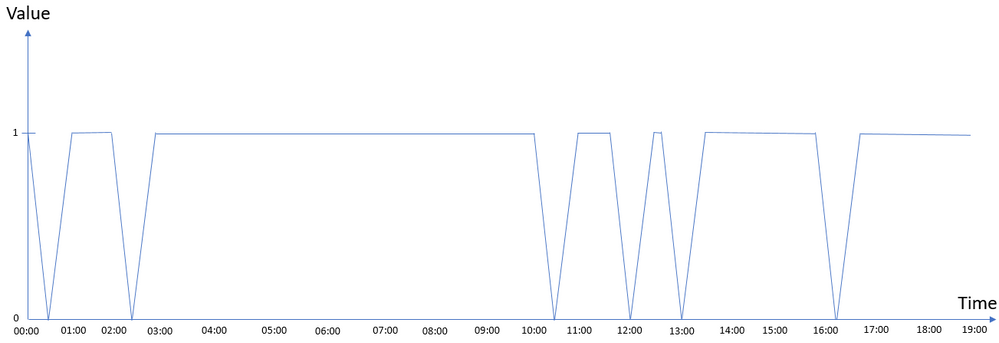
Any ideas on how to create this type of chart? Appreciating your time and effort in advance!
Attached sample working file for your reference.
Best Regards
QianNing
Accepted Solutions

 lironbaram
- Mark as New
- Bookmark
- Subscribe
- Mute
- Subscribe to RSS Feed
- Permalink
- Report Inappropriate Content
lironbaram
- Mark as New
- Bookmark
- Subscribe
- Mute
- Subscribe to RSS Feed
- Permalink
- Report Inappropriate Content
hi
attach is an example ,
hope this what you look for
s10157754
- Mark as New
- Bookmark
- Subscribe
- Mute
- Subscribe to RSS Feed
- Permalink
- Report Inappropriate Content
Dear LironBaram,
Thank you for your prompt reply, your solution works like a charm!
PS: May I know how can i have time interval to be every 1 hr instead of every 2 hr? So that i can change according to my own needs.
Best Regards
QianNing
lironbaram
- Mark as New
- Bookmark
- Subscribe
- Mute
- Subscribe to RSS Feed
- Permalink
- Report Inappropriate Content
hi
in the chart properties
go to the axes tab
there in the bottom right side , check the static step box and insert =1/24 as the expression
