Esri AcrGIS Online integration with Qlik GeoAnalytics
![]()
Introduction
Qlik GeoAnalytics gives us the power to perform spatial analysis within Qlik Sense and QlikView apps. While many Qlik customers have existing GIS tools, their spatial assets are quite o
...Esri AcrGIS Online integration with Qlik GeoAnalytics
![]()
Introduction
Qlik GeoAnalytics gives us the power to perform spatial analysis within Qlik Sense and QlikView apps. While many Qlik customers have existing GIS tools, their spatial assets are quite often sitting in silos. Combining spatial data with other data through Qlik's associative engine greatly enhances the business value that can be derived from such assets.
Some BI tools can make use of local files such as KML or Esri shape files as data sources, but this introduces security and maintenance headaches. With Qlik GeoAnalytics we have the capability to consume spatial content via hosted services. This document gives a step by step guide on how we can load data from secure content in ArcGIS to Qlik Sense.
The process described here is similar for for ArcGIS Online and on-premise, but I have only tried it out with ArcGIS Online.
The integration can be broken down into these steps:
- Implement App Login in ArcGIS
- Setup Qlik to get a security token
- Build a query for the secure content
- Load the data using Qlik GeoAnalytics
If the content is public, the process is simpler and you can skip the first two steps and ignore all the talk about tokens.
To try out these steps you will need an ArcGIS Online developer account which you can get here.
Implement App Login in ArcGIS
ArcGIS provides a way for applications to use secure content by using App Login. Once you register for a developer account, you'll see the option to create a new Application. Do that and you will be able to get the stuff we need to generate tokens in Qlik.
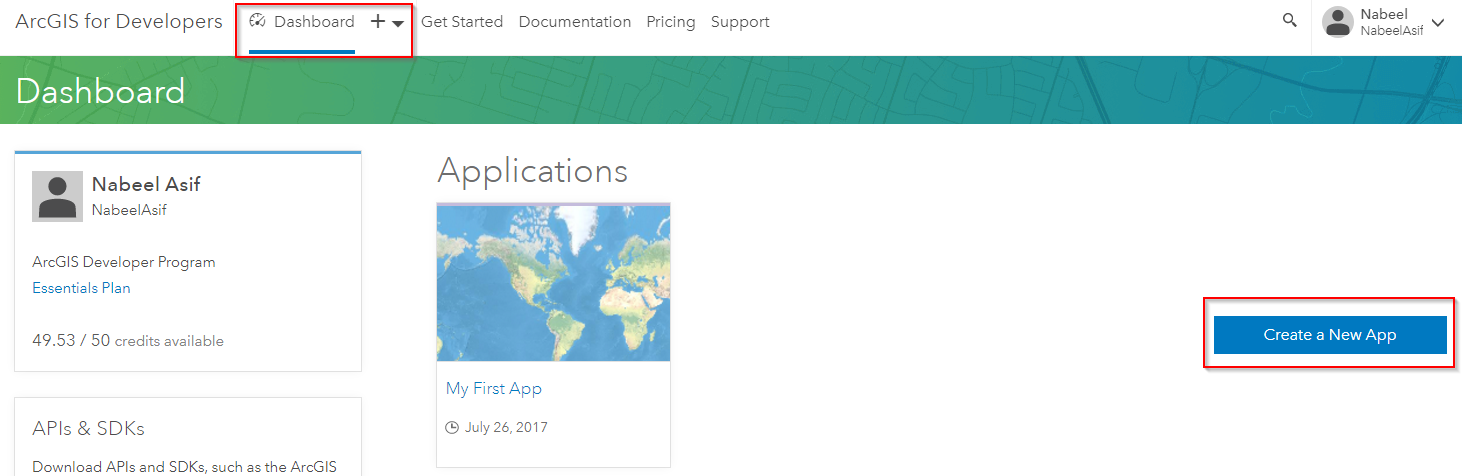

You'll need the Client ID and Client Secret to automate the process of getting new tokens in Qlik.
Setup Qlik to get a security token
We can use the Qlik REST connector to obtain a token in the load script. There is a good explanation of the process on the ArcGIS side here.
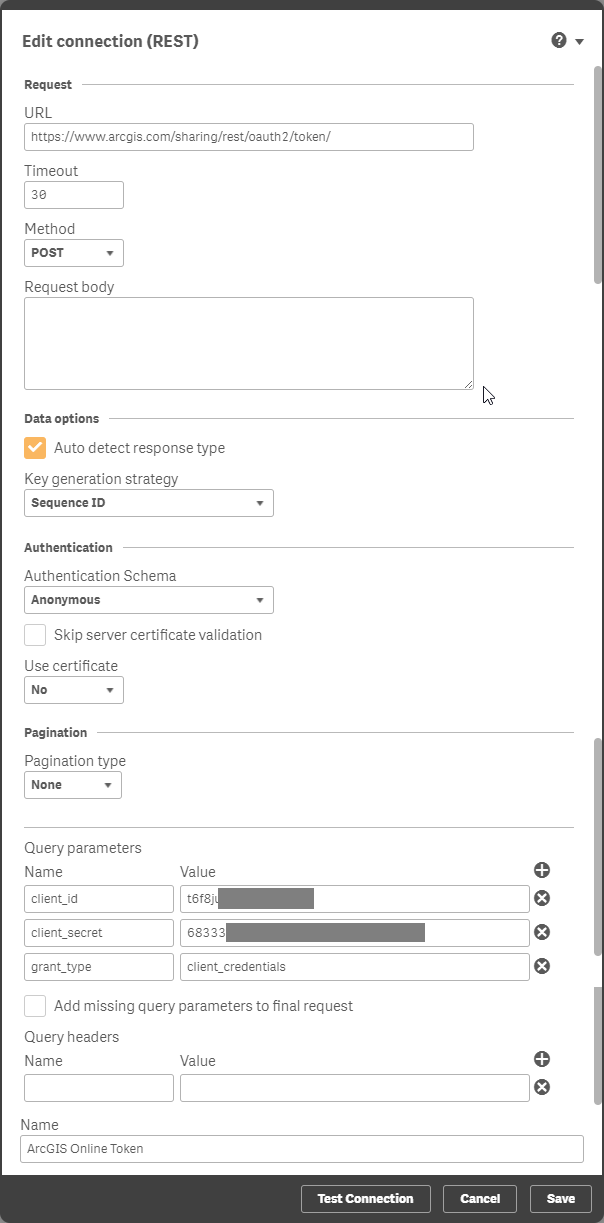
For ArcGIS online we need to make a request to: https://www.arcgis.com/sharing/rest/oauth2/token/
For an on-premise server the url will look like this: https://<host>:<port>/<subdirectory>/sharing/rest/oauth2/token
Create a new REST connection in Qlik Sense with the following parameters and the Client ID and Client Secret you obtained earlier.
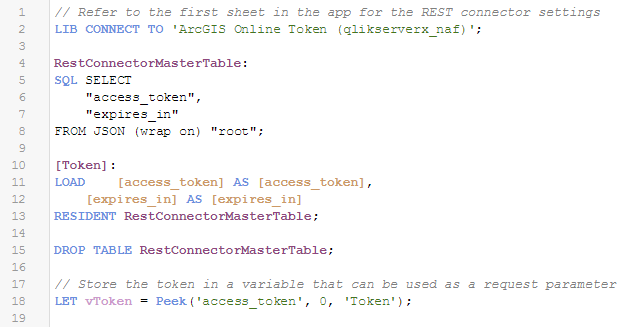
This will generate a load script to obtain the 'access_token'. Store the token into a variable in the load script. This can be done with the code below.
// Store the token in a variable that can be used as a request parameterLET vToken = Peek('access_token', 0, 'root');Tokens expire after a given period, but with this setup we can get the load script to obtain a new token before loading data from ArcGIS.
Run the load to confirm that you're able to obtain a token. Copy the token text as we'll need that to build a query. One way of doing this is to export it from a table object in Qlik Sense.
Build a query for the secure content
You'll need some private content on ArcGIS Online to test out this bit. Create a new layer by uploading some spatial content such as a zipped shape file.
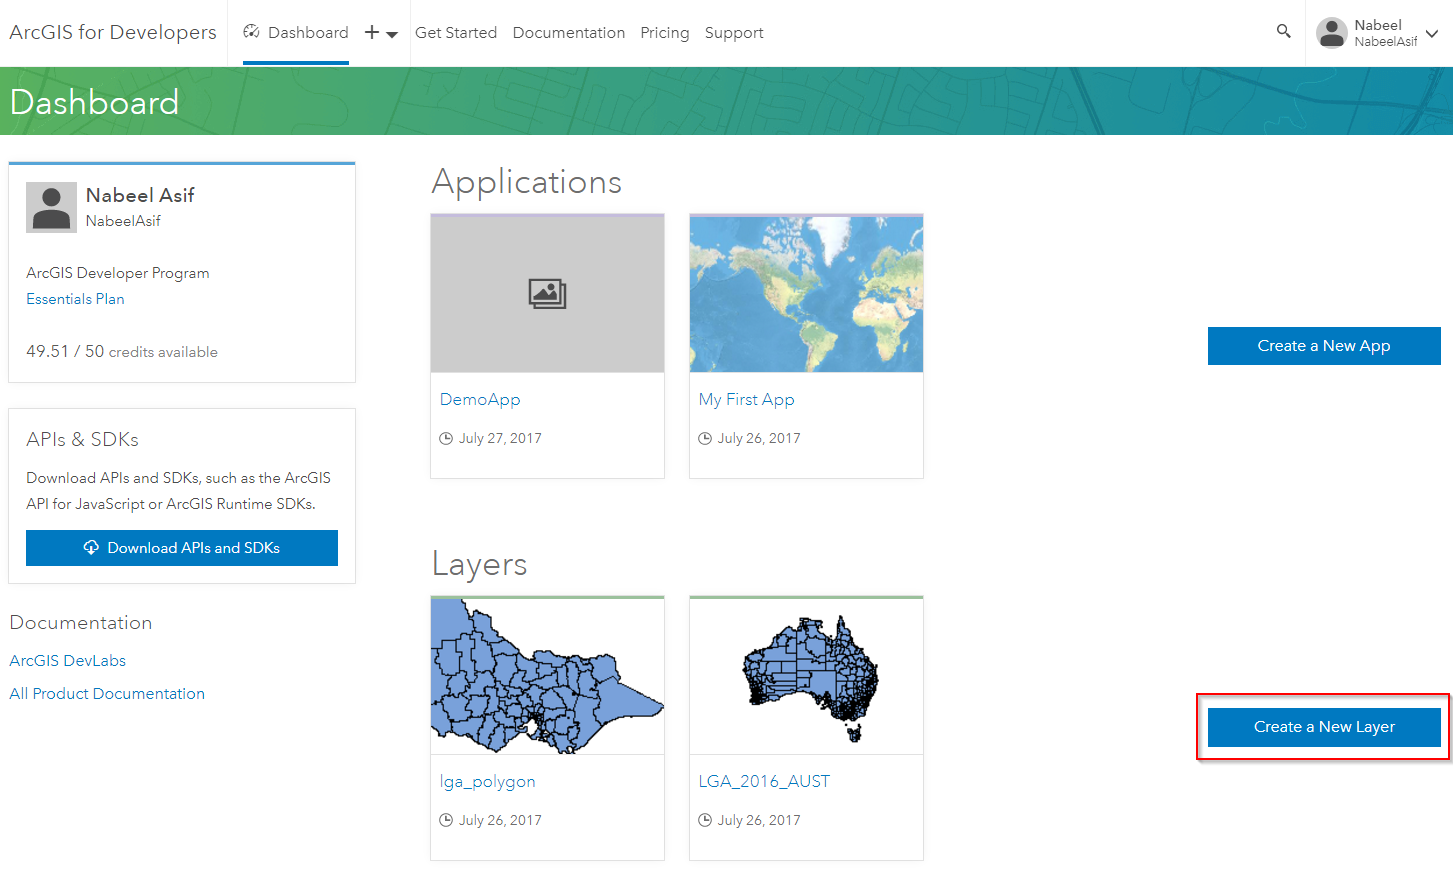
Make sure the security is set as private.
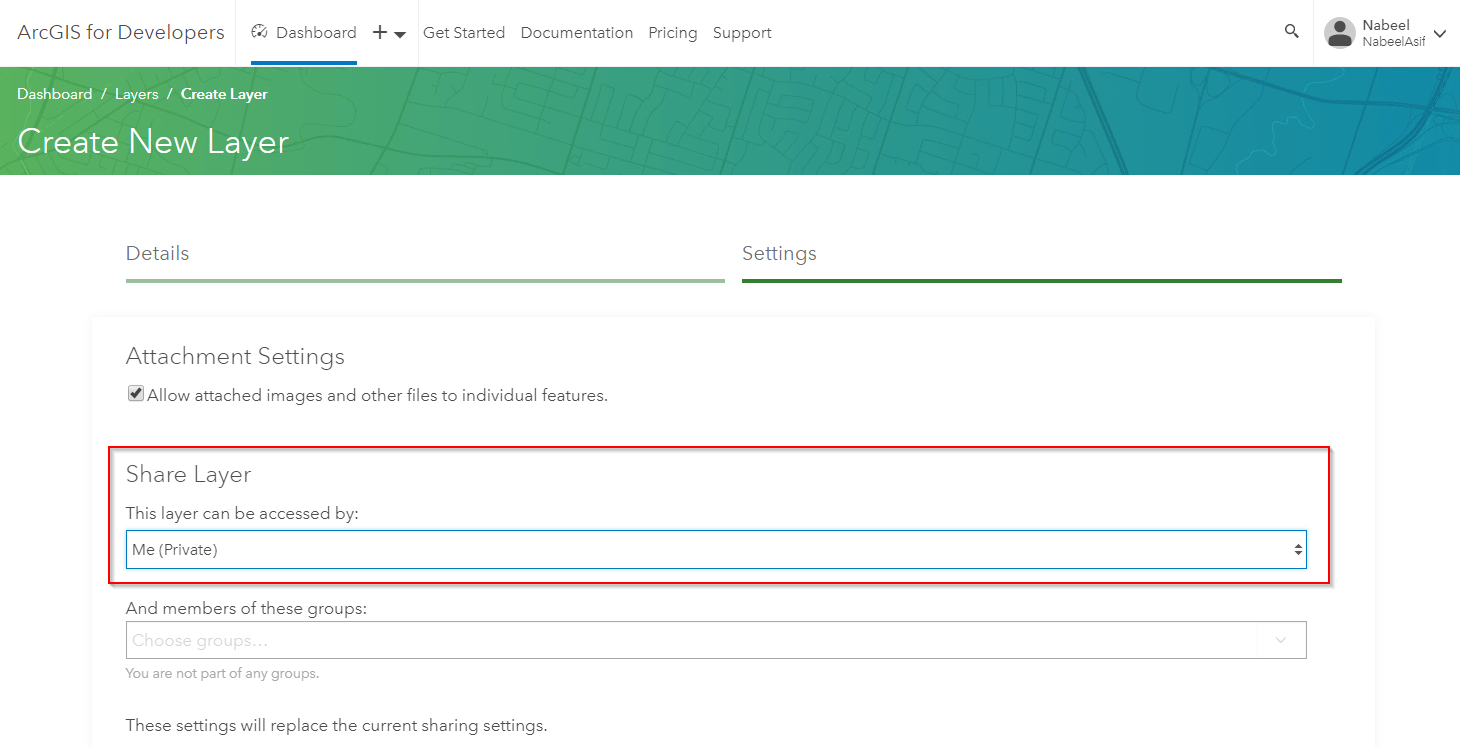
Once the layer is created you will be able to get a Service URL.
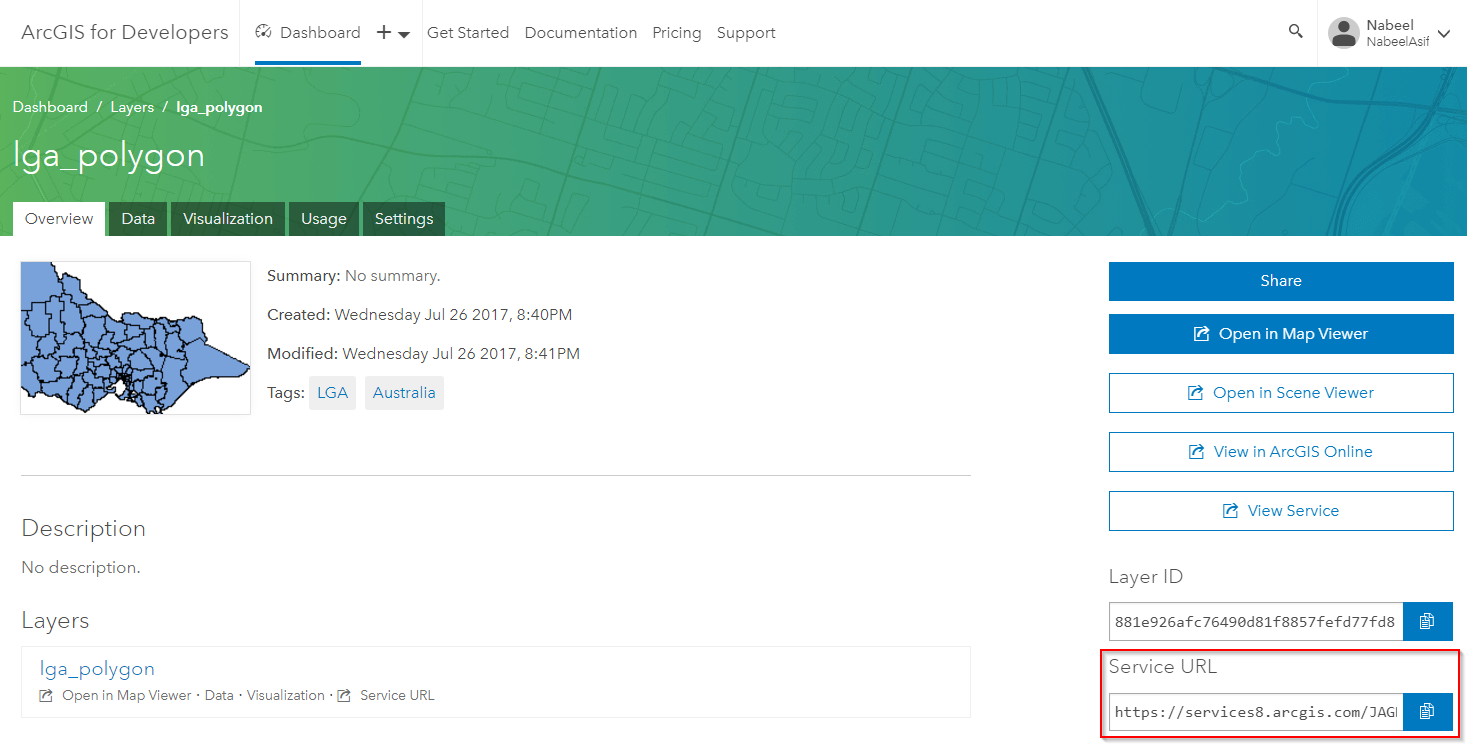
You can validate that the layer is private by trying out this URL in your browser. You should see a 'Token Required' message.
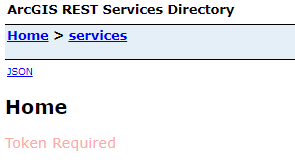
You can add the token we obtained earlier to the URL manually using the syntax: <Service URL>?token=<token>
This lets you get to the Service Directory. From here click on the layer name, scroll all the way to the bottom and click on Query.
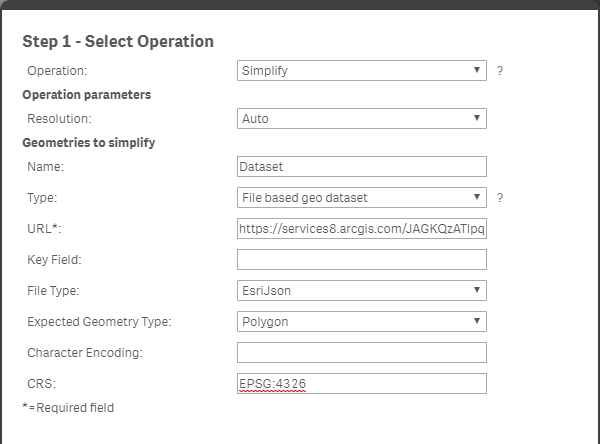
You now need to build a query for this layer. I've highlighted the most common parameters you might need to set for the query. Once you're done click on the Query (GET) button.
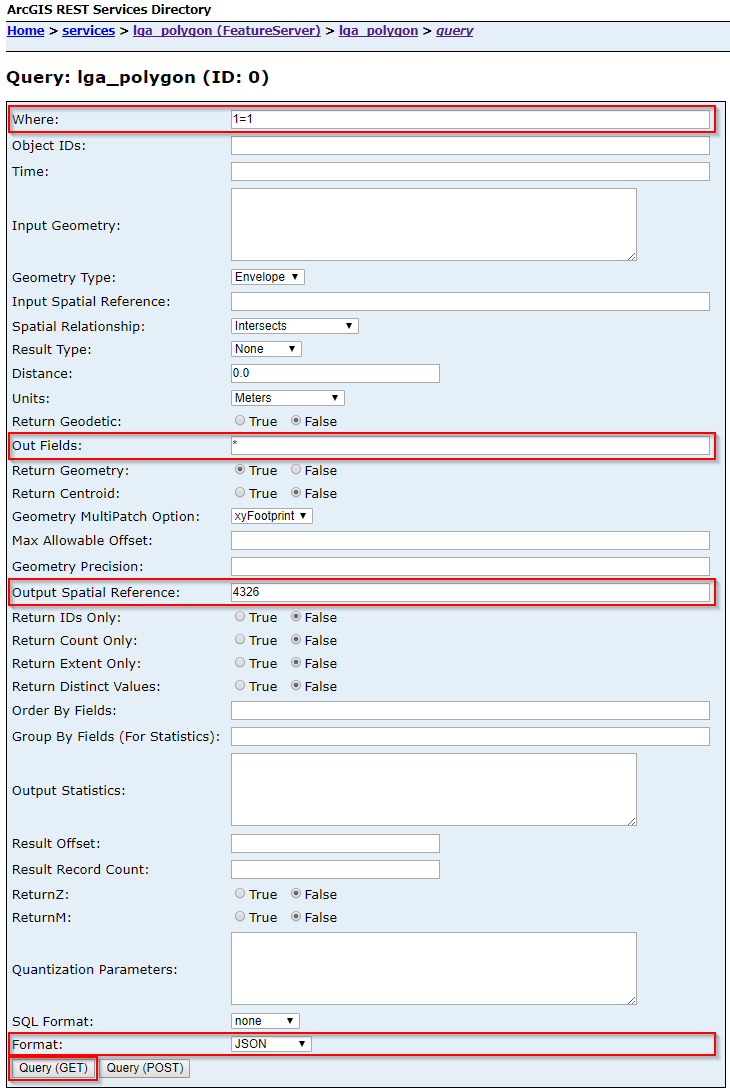
If everything goes well you should see the JSON output of the query in your browser. Copy the URL from your browser's address bar as we will use this for loading the layer in Qlik GeoAnalytics.
Load the data using Qlik GeoAnalytics
We can now use the URL we obtained for the query to load the layer into Qlik Sense. If you are loading a polygon layer I would recommend using the Simplify operation in the GeoAnalytics connector and excluding the original geometry field in the load. If you are loading a point layer you can use the Load operation.

Once GeoAnalytics has generated the script you can change the hard coded token with the variable using dollar sign expansion i.e. $(vToken).
![]()
You should now be able to load the secure ArcGIS content into your Qlik Sense app.
This is from a lunch and learn delivered on 1/18/23 that provided information and examples on how to use show/hide conditions in Qlik Sense.
HERE is link to video.
This is from a lunch and learn delivered on 1/18/23 that provided information and examples on how to use show/hide conditions in Qlik Sense.
HERE is link to video.
- Labels:
-
Qlik Sense
Recently we’ve been adding a lot of content on our Qlik Sense Enterprise server. This combined with frequent reloads for near real-time data means our ArchivedLog folder is growing fast. With a 1 year retention in place, we’re currently sitting at 32
...Recently we’ve been adding a lot of content on our Qlik Sense Enterprise server. This combined with frequent reloads for near real-time data means our ArchivedLog folder is growing fast. With a 1 year retention in place, we’re currently sitting at 32gb. I expect we’ll double this by the end of the year. This may not seem like much but with the current disk space available in our SAN, it’s becoming a problem (There’s not just Qlik that’s growing rapidly).
I looked into multiple solutions such as having a daily/weekly script run to timestamp & zip files and keep them available for audit purposes but I still wanted to have my files available without restoring anything. That’s when I thought about using the almost forgotten feature, NTFS compression. This feature was once seen as bad because CPU power was much more limited than today and we’re now also running on SSDs. Both of these factors have made file compression a non issue.
I simply navigated to my ArchivedLog directory and enabled file compression (may take a while…). All the files were compressed and I was now using 60% less space than before with no impact whatsoever on my task durations.
Please note that you should be attempting this on your Dev environment first AND that this is better done outside business hours as there is a chance you will encounter file locking while the compression is running for the first time.
I like this feature as I have nothing to script and test and I can always turn this off without any issues. None of my app reloads, including the monitoring apps that read log files have increased in load times.
Let me know if your savings are as good or better as mine!

Environment
- Qlik Sense Enterprise November 2021
The information in this article is provided as-is and to be used at own discretion. Depending on tool(s) used, customization(s), and/or other factors ongoing support on the solution below may not be provided by Qlik Support.
Related Content
Refer to this page for a written guide on enabling file compression.
- Labels:
-
Other
-
Qlik Sense
Did you wake up today with a daring spirit?
Would you like to try a radical makeover?
or simply explore new possibilities and ideas for your developments?
These materials are part of a demo presented previously by the Qlik presales team.
Here you'll fi
Did you wake up today with a daring spirit?
Would you like to try a radical makeover?
or simply explore new possibilities and ideas for your developments?
These materials are part of a demo presented previously by the Qlik presales team.
Here you'll find the Netflix.qvf example and a Netflix.zip theme that needs to be installed with the demo.
And, IMPORTANT, an extension, created by me, called SmartCards, that makes the magic of the dynamic interaction with the films.

The package is designed to work in any site : SaaS, Desktop and QSEoW.
If you use SaaS, remember to update the variable vTenantId as suggested at the beginning of the demo:

All the instructions to configure it are available in the README.md file.
Check particular needs for SaaS and Client Managed!
All the materials (qvf, extension and theme) are available through this link.
Hope you like it, I look forward to your comments!
Ivan
In this series of video and documents, I will walk though a real life example of finding my dream home in Singapore using data from various sources, combining with Qlik GeoAnalytics to analyse the suitable units based on distance to MRT station and w
...In this series of video and documents, I will walk though a real life example of finding my dream home in Singapore using data from various sources, combining with Qlik GeoAnalytics to analyse the suitable units based on distance to MRT station and within 1km of a Primary School.
In Singapore we have government houses which is term as HDB (Housing Development Board) flats which is the most affordable form of housing. We can buy a newly built HDB unit or from the resale market. New HDB units are cheaper but due to the current pandemic, all the building projects are being delayed due to shortage of manpower and supplies. I have no choice but to look at the resale market. So instead of approaching a property agent, I would like to do some homework on the resale property market and the potential unit that meet most if not all of my considerations.
All the resale transactions of the HDB flats are available at https://data.gov.sg/dataset/resale-flat-prices. I can use Qlik Sense to ingest this set of data to analyse the past trend and to gauge whether my existing budget is enough. On top of that I also want to live near my parents-in-law as I will need their help to take care of my children. One of them is going to Primary School and in Singapore, living near to a Primary School affects priority admission. I would like to live within 1km circle of an ideal Primary School. As I will need to take public transport to work, so distance to the nearest MRT (Mass Rapid Transit) or LRT (Light Rail Transit) is also a factor.
I have build a Qlik Sense dashboard with all these considerations and the following is a video on how I use the dashboard to find my dream home.
I have also documented all the building blocks of this dashboard as follows:
Part 1a - How to build the base dashboard (Video)
Part 1b - How to build the base dashboard (Guide)
Part 2 - How to geocode a HDB block and Binning
Part 3 - How to calculate distance to MRT/LRT
- Labels:
-
GeoAnalytics
-
Qlik Sense
-
SaaS
Prior to the release of Qlik Application Automation (QAA), the process to review applications that need to be published to managed spaces was either manual or required heavy coding with APIs. QAA makes it possible to do this in almost entirely a dra
...Prior to the release of Qlik Application Automation (QAA), the process to review applications that need to be published to managed spaces was either manual or required heavy coding with APIs. QAA makes it possible to do this in almost entirely a drag-and-drop interface.
To make this even easier, I have provided the files needed to do the following:
- Assign app review to a specific reviewer
- Review and update applications as needed
- Approve or Reject applications
- Track Approvals and Rejections in a Qlik Sense app
- Provide a weekly report of applications that are still awaiting a review conclusion
What you need to create in your environment:
- A managed space where anyone who is allowed to submit applications for approval has publish rights
- A shared space where Reviewers have Can consume rights
- The person who is uploading the automations will need TenantAdmin rights
How you will need to set this up:
- Download the .zip and extract all files
- The .qvf should be uploaded to the shared space mentioned above
- Load in the .json files attached as automations (Create a new automation, give it a name, then right click on white space and select "upload workspace")
- Look through all of the blocks for comments that say "NEEDS INPUT!" and provide the necessary input
Please refer to the linked video to see how this workflow will look once completed.
Environment
- Qlik Automate
- Qlik Cloud
- Microsoft Teams
The information in this article is provided as-is and to be used at own discretion. Depending on tool(s) used, customization(s), and/or other factors ongoing support on the solution below may not be provided by Qlik Support.
Related Content
Workflow Demo: https://youtu.be/5L81_8QFC7M
Hi Qlikers,
Differently from QlikView, Qlik Sense applications are developed on the browser which means that identifying applications based on the interface becomes tricky. The configurations documented here were done to provide clear differentiation
...Hi Qlikers,
Differently from QlikView, Qlik Sense applications are developed on the browser which means that identifying applications based on the interface becomes tricky. The configurations documented here were done to provide clear differentiation between Prod and Dev environments and do not affect the application, they have effect only on the environment. So, the application can be moved from Dev to Prod without any particular change on it.
Best regards,
Huberto Pereira Haidemann
I am making this post because we are soon switching to a new IP data provider.
The new data contains more ip entries with City name but provides no admin codes
where previously we had admin code for some of the ip entries.
I am sharing two example apps
I am making this post because we are soon switching to a new IP data provider.
The new data contains more ip entries with City name but provides no admin codes
where previously we had admin code for some of the ip entries.
I am sharing two example apps here that shows how to do IP data lookup
followed by a closest operation in order to retrieve the closest admin area
for each IP address.
The app "IPDataUSAdm1Code_GeoConnector.qvf" contains a load script for
Qlik Sense Server/Desktop using the GeoAnalytics connector.
It also contains some sheets that explains how to generate that load script.
The app "IPDataUSAdm1_GeoOperations.qvf" contains a load script that uses
GeoAnalytics operations. GeoAnalytics operations is only available on Qlik Cloud Services.
Both apps contains US ip addresses as examples but the apps should work with
other countries if the list of ip addresses is replaced. Some countries have both a number code and a letter code for their admin areas, if the code retrieved from the operation is not of the type you want there is always the option of retrieving admin name instead.
- Tags:
- geoanalytics
- Labels:
-
GeoAnalytics
Second list of words that appears during a standar customer installation.
Please let me know if i went wrong with any concept.
Concept | Brief Description |
ABAC | Attribute Based Access Control, also known as policy-based access control for IAM, defines an acc |
Second list of words that appears during a standar customer installation.
Please let me know if i went wrong with any concept.
Concept | Brief Description |
ABAC | Attribute Based Access Control, also known as policy-based access control for IAM, defines an access control paradigm whereby access rights are granted to users through the use of policies which combine attributes together. |
IAM | AWS Identity and Access Management (IAM) is a web service that helps you securely control access to AWS resources. Use IAM to control who is authenticated (logged in) and authorized (has permissions) to use resources. |
Rugged software | For software to be considered as rugged, it must cope with all potential threats to the confidentiality, integrity, and availability of the information, and be robust when used in ways not anticipated. |
NTLM | In a Windows network, NT (New Technology) LAN Manager (NTLM) is a suite of Microsoft security protocols intended to provide authentication, integrity, and confidentiality to users. NTLM is the successor to the authentication protocol in Microsoft LAN Manager (LANMAN), an older Microsoft product. |
UPN | In Windows Active Directory, a User Principal Name (UPN) is the name of a system user in an email address format. A UPN (for example: john.doe@domain.com) consists of the user name (logon name), separator (the @ symbol), and domain name (UPN suffix). |
Kerberos | Is a computer-network authentication protocol that works on the basis of tickets to allow nodes communicating over a non-secure network to prove their identity to one another in a secure manner. |
STRIDE | Is a model of threats developed by Praerit Garg and Loren Kohnfelder at Microsoft[1] for identifying computer security threats.[2] It provides a mnemonic for security threats in six categories.[3] |
Checksums | Is a small-sized datum derived from a block of digital data for the purpose of detecting errors that may have been introduced during its transmission or storage. By themselves, checksums are often used to verify data integrity but are not relied upon to verify data authenticity. |
PEM | Is an ASCII text format for public certificates. It is portable across platforms |
JWT | JSON Web Token is an open standard for secure transmission of information between two parties as a JavaScript Object Notation (JSON) object. JWT is used for authentication and authorization. Because JWT enables single sign-on (SSO) , it minimizes the number of times a user has to log on to cloud applications and websites. |
Certificates | Qlik Sense uses certificates to secure communication between components that are installed on different computers.A certificate is a data file that contains keys that are used to encrypt communication between a client and a server in a domain. Certificates also confirm that the domain is known by the organization that issued the certificate. |
SAML | Security Assertion Markup Language. Is an open standard for exchanging authentication and authorization data between parties, in particular, between an identity provider and a service provider. SAML is an XML-based markup language for security assertions (statements that service providers use to make access-control decisions) |
SPN | Service principal name, is a unique identifier of a service instance. |
SSO | Single sign-on is a centralized session and user authentication service in which one set of login credentials can be used to access multiple applications. |
log4net library | The Apache log4net library is a tool to help the programmer output log statements to a variety of output targets. log4net is a port of the excellent Apache log4j™ framework to the Microsoft® .NET runtime. We have kept the framework similar in spirit to the original log4j while taking advantage of new features in the .NET runtime. |
Kubectl | The kubectl command line tool lets you control Kubernetes clusters. |
Shared Persistence | This means that nodes share a single repository database and a network folder for the application files. You can either share the central node repository and application storage, or setup dedicated machines for repository and application storage. |
TLS | Transport Layer Security (TLS) is the successor protocol to SSL. TLS is an improved version of SSL. It works in much the same way as the SSL, using encryption to protect the transfer of data and information. The two terms are often used interchangeably in the industry although SSL is still widely used. |
UNC | Universal Naming Convention) A standard for identifying servers, printers and other resources in a network, which originated in the Unix community. A UNC path uses double slashes or backslashes to precede the name of the computer. |
- Labels:
-
Qlik Sense
-
Qlik Sense Business
The Qlik Alerting September 2020 release includes a new Qlik Sense monitoring app that will allow you to better understand what is happening with your Qlik Alerting environment. This will enable you to see the load on the system, the average processi
...The Qlik Alerting September 2020 release includes a new Qlik Sense monitoring app that will allow you to better understand what is happening with your Qlik Alerting environment. This will enable you to see the load on the system, the average processing times, the reason why an alert may not have been sent to the recipient and other information.
We have added a few shortcuts for you to get the data connections setup appropriately. Please follow the steps below to get the monitoring app setup:
Setting up the Data Connectors in Qlik Sense.
This is a little detailed to setup manually so we have added a .bat file in the installer to push the connections using the correct attributes from your Qlik Alerting installation. You need to have completed the registration process if this is a new install of Qlik Alerting as this process will use the data source and Qlik Alerting config settings to create the data connectors.
Steps to follow:
- On the Qlik Alerting server, navigate to the C:\Program Files\Qlik Alerting\setup\monitoring-connection folder
- Double click the connections.bat file to run
- The process will offer and explanation and then will prompt you to enter a username and password. These are the username and password you use to logon (as an administrator) to Qlik Alerting.
- Check the Qlik Sense QMC and you should see two new data connections monitor_alerting and monitor_alerting_login
Import and reload the Qlik Alerting Monitoring Qlik Sense application
Once the connections have been created you can now import the Qlik Sense application that can be found in the C:\Program Files\Qlik Alerting\setup\monitoring-connection folder.
Steps to follow:
- In the Qlik Sense QMC, import the Qlik Sense application that can be found in the C:\Program Files\Qlik Alerting\setup\monitoring-connection folder. This file is called Qlik Alerting Monitoring.qvf
- Open the application in the Qlik Sense Hub and go to the Data Load Editor view
- In the Set Load Details tab of the script find the vServer variable and enter your Qlik Alerting server details,
e.g. https://QlikAlertingServerName.Comapny.com:4552 - Click reload to test the connections work appropriately.
Troubleshooting
If the reload does not work straight away here are a few things to check:
- Check you have entered the correct Qlik Alerting user credentials when creating the data connections. You can validate this by looking at the monitor_alerting_login connection and checking the username and password in the URL. They will be surrounded by %3 (encoded quotes) so please do not remove these.
- Check that the URL is correct in the data connection. The URL entered into the data connection comes from the Qlik Alerting config step where you enter the hast of the Qlik Alerting server. It is possible that you have not entered the fully qualified domain name here and will need to manually change this in the URLs of both the data connections.
- Check that you have entered the correct fully qualified server name and port in the vServer variable in the script of the Qlik Alerting Monitoring Qlik Sense application. This is a manual step as we do not insert this during the data connection process.
Optional: Steps to create the data connections manually
If you really cannot follow the simple steps above to create the data connections, for security reasons for example, you can follow the instructions below to create them manually.
Setup the monitor_alerting_login data connection
This request makes the authentication request to Qlik Alerting and is required to get the authenticated session token to run the monitor_alerting api connections to actually retrieve the data.
- In Qlik Sense, create a new app in your my work area just to create and test the connections.
- Navigate to the data load editor.
- Create a new data connection using the REST data connection type
Enter the URL updating your <QA_Server> and <QA_https_port> values
https://<QA_Server>:<QA_https_port>/api/login
- Change the Method option to POST
In the body section that appears enter the following details adding your user and password as you would use to login to the Qlik Alerting portal
{"user":"<your_QA_username>","password":"<your_QA_password>"}In the query headers section enter
Name Value content-type application/json - Click on test connection and you should see a successful result message.
- Enter a name for this connection "monitor_alerting_login"
- Click on Create
- As a final step we want to make the name of this connection generic so any code parts below, and in the monitoring app, will work without changes.
- Navigate to QMC > Data Connections and find your new connection which will look like "monitor_alerting_login <domain_user>".
- Edit this record and remove the <domain_user> in the name field, along with any spaces that exist between the monitor_alerting_login and <domain_user>.
- Save the record
You are now setup to use this API to create a request to authenticate against Qlik Alerting. Follow the monitor_alerting setup below to see how this works.
Setup the monitor_alerting data connection
This request will be used to retrieve data from Qlik Alerting. We will be passing a different endpoint URL through this connection in the monitoring app script so we do not need to create a connection for each endpoint.
NOTE: this process is a little more complex as we will need the session token from running the monitor_alerting_login result to actually run this process. This is covered in the steps to help you through this.
- we will need to setup the monitor_alerting_login connection to retrieve the session token
- copy the script part below into a new tab in your script
edit the <QA_Server> and <QA_https_port> in the Let vURL variable
LIB CONNECT TO 'monitor_alerting_Login';

Let vURL = 'https://<QA_Server>:<QA_https_port>/api/login';

Connection:
LOAD [token],
[userId],
[userName],
[firstName],
[isAdmin],
[license],
[expiresOn]
;
SELECT
"token",
"userId",
"userName",
"firstName",
"isAdmin",
"license",
"expiresOn"
FROM JSON (wrap on) "root"
WITH CONNECTION(
Url "$(vURL)"
)
;

// Set new variable values
LET vAuth = Peek('token',0, 'Connection');
LET vUserId = Peek('userId',0,'Connection');
LET vUserName = Peek('userName',0,'Connection');
LET vAdmin = Peek('isAdmin',0,'Connection');

Trace >>>;
Trace >>> Auth $(vAuth);
Trace >>> User $(vUserId);
Trace >>>;

drop table Connection;
- Reload the application from the data load editor window but DO NOT close the script window yet.
- The script popup will show a number of trace items which present the variable outputs in the script text.
- Copy the Auth & User values and paste in a note as we will use this in the next step
- Create a new data connection using the REST data connection type
- Enter the URL updating your <QA_Server> and <QA_https_port> values
https://<QA_Server>:<QA_https_port>/api/groups/users
- Leave the Method option as GET
In the query headers section enter the following two
Name
Value
authorization
<auth value copied from step 3>
userid
<user value copied from step 3>
- Click on test connection and you should see a successful result message.
- Enter a name for this connection "monitor_alerting"
- Click on Create
- Enter the URL updating your <QA_Server> and <QA_https_port> values
- As a final step we want to make the name of this connection generic so any code parts below, and in the monitoring app, will work without changes.
- Navigate to QMC > Data Connections and find your new connection which will look like "monitor_alerting <domain_user>".
- Edit this record and remove the <domain_user> in the name field, along with any spaces that exist between the monitor_alerting and <domain_user>.
- Save the record
You have now setup the two data connections and should be able to import and reload the Qlik Alerting Monitoring.qvf application as per the instructions above.
You can also find a copy of the QVF that was released with the September 2020 version attached to this document.
- Tags:
- alerting
- Labels:
-
Alerting
-
Qlik Alerting
Previously, I created a document for calculating working hours between two dates, excluding weekends (Saturday and Sunday) and holidays, using the networkdays function. Please refer to the link below.
...Previously, I created a document for calculating working hours between two dates, excluding weekends (Saturday and Sunday) and holidays, using the networkdays function. Please refer to the link below.
Working-Hours-Calculation-excluding-weekends-and-holidays
However, what if the weekends are not Saturday and Sunday (e.g., Thursday and Friday)? Or if only Sunday is considered a weekend, not Saturday? In such cases, the networkdays function won't be applicable. While there are many ways to address this, I will demonstrate one approach in this post.
I have detailed all scenarios step by step in the attached Word document and included example QVF files. This code is compatible with QlikView as well.
The logic described here can be applied to any defined weekends, but for regular weekends (Saturday and Sunday), I recommend using the built-in networkdays function for working day calculations. For working hour calculations, please refer to my previous document linked below.
Please feel free to share any suggestions.
- Labels:
-
App Development
-
Qlik Sense
6-minute video: https://www.youtube.com/watch?v=FQsTiMB9aX4
Building Excel-styled tables with different formulae on each row has always been a pain point in Qlik.
We have all created Excel styled spreadsheet using Valuelist as a dimen
...6-minute video: https://www.youtube.com/watch?v=FQsTiMB9aX4
Building Excel-styled tables with different formulae on each row has always been a pain point in Qlik.
We have all created Excel styled spreadsheet using Valuelist as a dimension and PICK MATCH in the expression in order to achieve the cell level control as it is in Excel.
However, this becomes hard to read and maintain when expressions in cells get extremely complex and also fidgety when you need to add new lines in an existing front-end Qlik table.
So I looked for an external way of maintaining these and am now sharing the framework and files to be able to easily create, maintain and change these Excel-style tables in Qlik.
Please watch the YouTube video for more ample information, explanation and instructions.
- Labels:
-
excel
-
QlikSense
-
QlikView
-
row level formulae
-
table
Comparing indicators with Multi KPI
Goal: compare current year with previous year sales in same KPI. See image below.

In load editor add script:
sales:
load * inline [
year, sale,
2017, 50198,
2018, 61532,
2019, 63182
];
1) Add Multi KPI object (extens
...Comparing indicators with Multi KPI
Goal: compare current year with previous year sales in same KPI. See image below.
In load editor add script:
sales:
load * inline [
year, sale,
2017, 50198,
2018, 61532,
2019, 63182
];
1) Add Multi KPI object (extension Qlik Sense)

2) Add a dimension
=ValueList('Current year', 'All')
3) Add variables


4) Configure KPI appearance

Properties Appearance > Dimensions
- Hide labels: true
- Center aligned labels: true
- Hide external borders: true
- Hide internal borders: true
5) Add a measure Current Year Sales

Properties:
- Expression: =sum({<year={"$(vCurrentYear)"}>} sale)
- Label: ='Sales $(vCurrentYear)'
- Number formatting: Money
- Group by dimension: true
- Dimension Value: Current year

- Icon: ='lui-icon lui-icon--line-chart'
- Icon size: Large
6) Add a measure Previous Year Sales
Properties:
- Expression: =sum({<year={"$(vPreviousYear)"}>} sale)
- Label: ='from $(vPreviousYear)'
- Number formatting: Money
- Label color: #7b7a78
- Value color: #7b7a78
- Group by dimension: true
- Dimension Value: Current year
- Override parameters: true
- Size: Tiny
- Labels order: Value, Label

7) Add a measure Current Year vs Previous Year Percentage
Properties:
- Expression: =(sum({<year={"$(vCurrentYear)"}>}sale)/sum({<year={"$(vPreviousYear)"}>}sale))-1
- Number formatting: Number (12,34%)
- Label color: #7b7a78
- Value color: #7b7a78
- Hide label: true
- Group by dimension: true
- Dimension Value: Current year
- Override parameters: true
- Size: Mini
- Icon: =if((Sum({<year={"$(vCurrentYear)"}>}sale)/Sum({<year={"$(vPreviousYear)"}>}sale))-1>0,'lui-icon lui-icon--triangle-top','lui-icon lui-icon--triangle-bottom')
- Icon position: Value
- Icon order: Value, Icon

8 ) Add a measure All sales
Properties:
- Expression: =sum(sale)
- Label: All
- Number formatting: Money
- Group by dimension: true
- Dimension Value: All
- Icon: ='lui-icon lui-icon--sheet'
- Icon size: Large
9) Add a measure Annual average
Properties:
- Expression: =sum(sale)/count(distinct year)
- Label: annual average
- Number formatting: Money
- Label color: #7b7a78
- Value color: #7b7a78
- Group by dimension: true
- Dimension Value: All
- Override parameters: true
- Size: Tiny
- Labels order: Value, Label
Done!
Best regards,
Ezir
NOTE: The Qlik Help Channel on YouTube has the latest and greatest how-to's for the latest releases.
Don't forget about the Qlik Online Help as well. It has videos, samples, tutorials and more.
How we can creating a gantt chart in qlik Sense without
...NOTE: The Qlik Help Channel on YouTube has the latest and greatest how-to's for the latest releases.
Don't forget about the Qlik Online Help as well. It has videos, samples, tutorials and more.
How we can creating a gantt chart in qlik Sense without use any extension .
Ex: we can also create gantt chart in qlik Sense through anychart extension .
This workshop contains the following 3 topics, and was run at Qonnections 2019.
TABLE OF CONTENTS
Exercise 1 - How to improve Lookup Accuracy
Exercise 2 - IP lookup and how to visualize “Internet users”
Exercise 3 – How to map a picture
The detaile
...This workshop contains the following 3 topics, and was run at Qonnections 2019.
TABLE OF CONTENTS
Exercise 1 - How to improve Lookup Accuracy
Exercise 2 - IP lookup and how to visualize “Internet users”
Exercise 3 – How to map a picture
The detailed instructions including all data and example applications are attached in the zip file. The estimated time to run the excercises is around 2 hours.
Prerequisties: Qlik Sense Feb- and Qlik GeoAnalytics.
Special thanks to Patric Nordström, Director, and Johan Persson, Sr Architect, for all their contribution to this workshop.

- Tags:
- geoanalytics
This video shows you how to add a background layer in a Qlik Sense map. Starting from Qlik Sense April 2019 release, it is now possible to set a default map background for all new map charts. Enabling further customization of backgrounds, now users c
...This video shows you how to add a background layer in a Qlik Sense map. Starting from Qlik Sense April 2019 release, it is now possible to set a default map background for all new map charts. Enabling further customization of backgrounds, now users can choose to set their own predefined background instead of using the Qlik standard background.
This feature provides better support for handling geographic considerations such as disputed regions with politically sensitive boundaries.
You can use the qvf attached to try out this and the other Qlik Sense feautures included in Qlik Sense April 2019 release.
This post explains how to connect to an Oracle database using the OLE DB connector and a tnsnames.ora file.
- Download the latest version of the Oracle Database Client for Windows (x64). You can use this link or Google it.
- Unzip the file and double-click
This post explains how to connect to an Oracle database using the OLE DB connector and a tnsnames.ora file.
- Download the latest version of the Oracle Database Client for Windows (x64). You can use this link or Google it.
- Unzip the file and double-click on setup.exe.
- Select custom installation and follow the installation instructions.

- Choose an intallation folder (E.g., C:\oracle).

- Select components Oracle Net, Oracle ODBC Driver and OLE DB.

- Click on Next and finish the installation.
- Type environment variables in Windows' search bar and open the app. Then, click on Environment variables.

- Create a user variable named TNS_ADMIN and set its value to the path of the folder where your tnsnames.ora file is located.

- Open Qlik Sense and create a new OLE DB connection. In the Data Source textbox, type the name of the connection as it is in the tnsnames.ora file.

- Tags:
- connection
- ole db
- oracle
- qlik sense
- tnsnames
- Labels:
-
How To
-
OLEDB
-
ORACLE
-
Qlik Sense
-
tnsnames
Examples and guides for the Qlik GeoAnalytics Connector operations. The examples are self sufficient with data and reloadable. The examples are minimal to explain to basic functionality. Please use the documentation for details of the operations.
Alth
...Examples and guides for the Qlik GeoAnalytics Connector operations. The examples are self sufficient with data and reloadable. The examples are minimal to explain to basic functionality. Please use the documentation for details of the operations.
Although the examples are made with Qlik Sense the load script code will work in QlikView too. The following operations are covered
- AddressPointLookup (Separate license required, Qlik Geocoding)
- Binning
- Closest
- Cluster Guide
- Dissolve Guide
- Intersects
- IntersectsMost
- IpLookup
- Load
- NamedAreaLookup
- NamedPointLookup
- PointToAddressLookup (Separate license required, Qlik Geocoding)
- Routes
- Simplify
- SpatialIndex
- TravelAreas
- Within
Edit, the examples have been updated to use map chart.
Hi All,
This document is about calculating rolling n period data.
Attached is the Script , sample data and script for master calendar.
Regards,
Neha
Hi All,
This document is about calculating rolling n period data.
Attached is the Script , sample data and script for master calendar.
Regards,
Neha
[2 - Testing the D3 visualization in HTML]
3 - Importing the D3 visualization into Qlik Sense
4 - Customizing the D3 with Qlik's data
5 - Drawing a second indicator as a reference line [coming soon]
6 - Creating Custom Settings by editing
...[2 - Testing the D3 visualization in HTML]
3 - Importing the D3 visualization into Qlik Sense
4 - Customizing the D3 with Qlik's data
5 - Drawing a second indicator as a reference line [coming soon]
6 - Creating Custom Settings by editing CSS from Javascript [coming soon]
2 - Testing the D3 visualization in HTML:
The D3.js code we’ll be using is here. Our goal in this section will be testing, exploring, and preparing our D3 visualization before we import it into Qlik Sense as an extension.
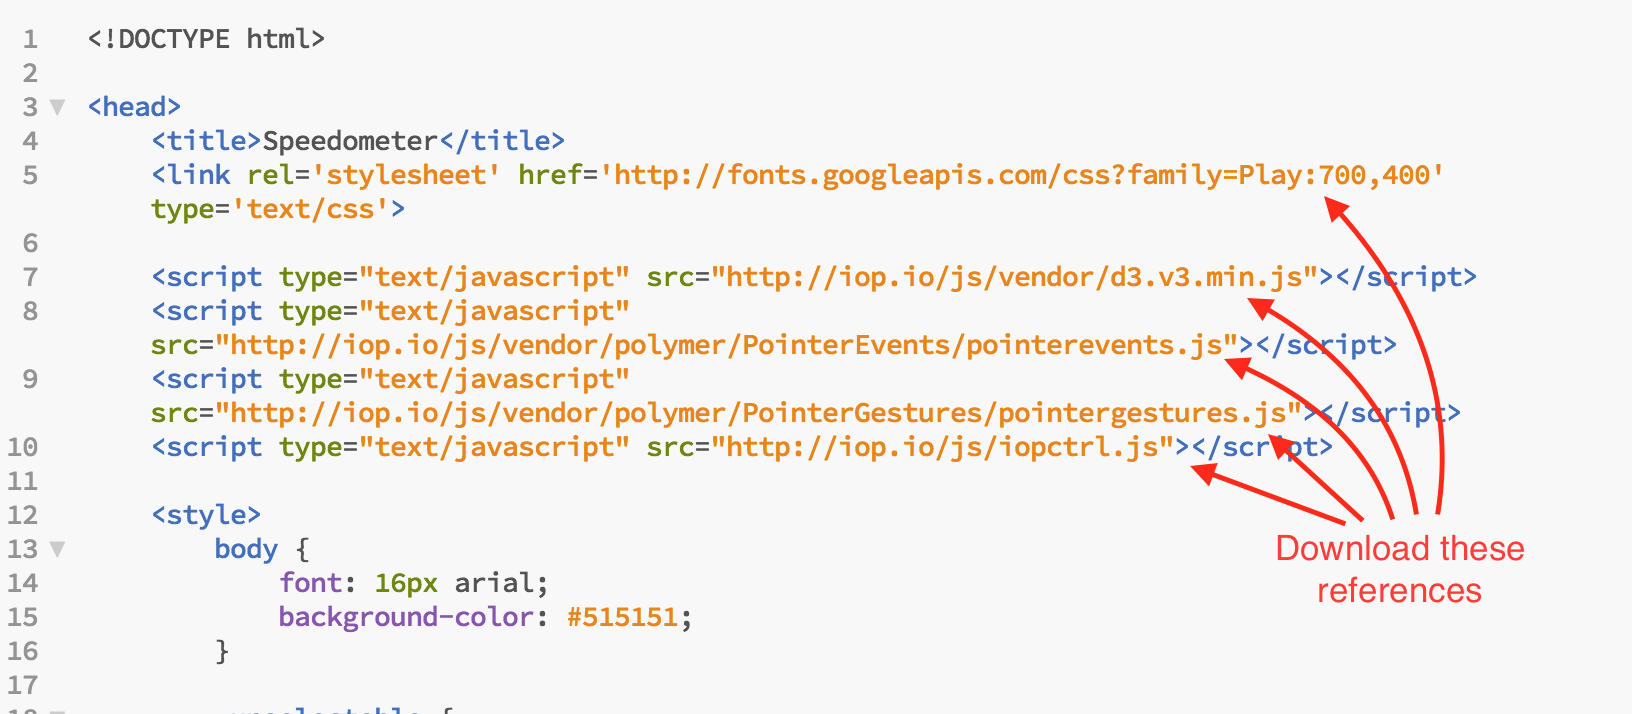
The first thing we’ll do is copy all of the HTML code under the visualization and paste it in the empty Test.html file we downloaded in the introduction article (here if you haven't).
At the top of the HTML code, there are links to the necessary files the visualization uses to run. We’ll need to download these files by opening/saving their references before we jump into extension development. To save time, you can download them here and add them to our extension folder.
We’ll also cut the CSS stylizing code between the <style> tags in the HTML code and paste it in the empty “original.css” file we downloaded in the Introduction article (then get rid of the <style> tags).
After adding all these files to our extension folder, we’ll change the <link> tags at the top of our HTML to refer to them instead of the online links:
    <link rel='stylesheet' type='text/css' href="googleplay.css">
    <link rel='stylesheet' type='text/css' href="originald3.css">

    <script type="text/javascript" src="d3.min.js"></script>
    <script type="text/javascript" src="pointerevents.js"></script>
    <script type="text/javascript" src="pointergestures.js"></script>
    <script type="text/javascript" src="iopctrl.js"></script>
Now that we have all our resources ready (our extension folder should be like this now), we’ll execute our new .html file in a browser to check that the D3 visualization works before importing it as an extension in Qlik Sense.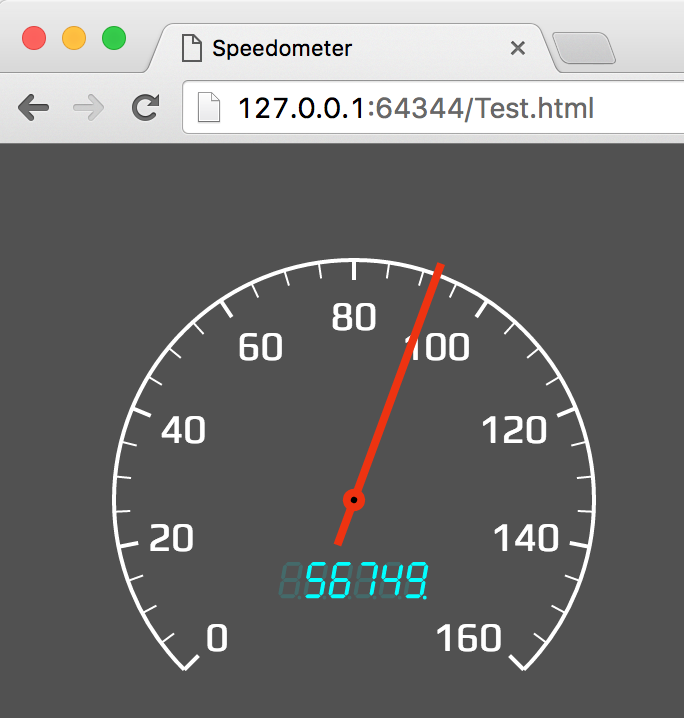
This is also a good place to check how the code works and change its variables around to understand what parts of the code changes what aspects of the visualization. For now, let's find out what changes the gauge's value. At the end of the javascript <script> tags, we'll find the line:
gauge.value(92);If we change the number 92 to 36, for instance, we can refresh the Test.html webpage in the browser to see the gauge indicator change to 36:
Now we have all our D3 files and testing area ready. In the next section, we’ll start importing the D3 visualization into Qlik as an extension.