Unlock a world of possibilities! Login now and discover the exclusive benefits awaiting you.
- Qlik Community
- :
- All Forums
- :
- QlikView
- :
- Line chart dimension values color
- Subscribe to RSS Feed
- Mark Topic as New
- Mark Topic as Read
- Float this Topic for Current User
- Bookmark
- Subscribe
- Mute
- Printer Friendly Page
- Mark as New
- Bookmark
- Subscribe
- Mute
- Subscribe to RSS Feed
- Permalink
- Report Inappropriate Content
Line chart dimension values color
Hello,
how can I set color for dimension values on line chart?
regards
Darek
Accepted Solutions
- Mark as New
- Bookmark
- Subscribe
- Mute
- Subscribe to RSS Feed
- Permalink
- Report Inappropriate Content
I hope you are talking about changing color of x axis value appearing as legend values
go to
Axes >> Dimension Axis >> FONT >> Change color
- Mark as New
- Bookmark
- Subscribe
- Mute
- Subscribe to RSS Feed
- Permalink
- Report Inappropriate Content
From attached snap look for text color
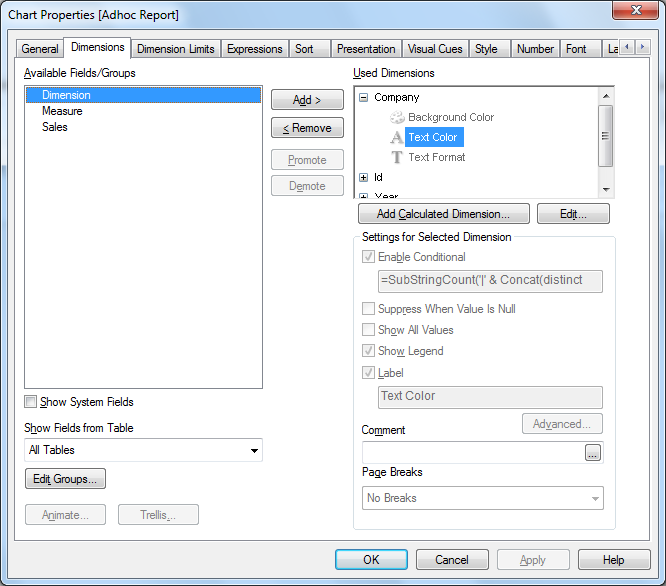
Set the color values like Red(), Grey() or you can use RGB(231,145,124) and combination of color
- Mark as New
- Bookmark
- Subscribe
- Mute
- Subscribe to RSS Feed
- Permalink
- Report Inappropriate Content
I tried it, but with no effect 
Neither red(), or =red().
I also tried many other color settings i found in properties of line chart, but still cant change color of values presented under X Axis...
- Mark as New
- Bookmark
- Subscribe
- Mute
- Subscribe to RSS Feed
- Permalink
- Report Inappropriate Content
I hope you are talking about changing color of x axis value appearing as legend values
go to
Axes >> Dimension Axis >> FONT >> Change color
- Mark as New
- Bookmark
- Subscribe
- Mute
- Subscribe to RSS Feed
- Permalink
- Report Inappropriate Content
They could not hide it deeper ....:)
That is exactly what i was looking for. @Manish, thank you very much.
@Anand, I also thank you for your response.
greetings
Darek