Unlock a world of possibilities! Login now and discover the exclusive benefits awaiting you.
- Qlik Community
- :
- All Forums
- :
- QlikView
- :
- Design a Self-Service Sheet
- Subscribe to RSS Feed
- Mark Topic as New
- Mark Topic as Read
- Float this Topic for Current User
- Bookmark
- Subscribe
- Mute
- Printer Friendly Page
- Mark as New
- Bookmark
- Subscribe
- Mute
- Subscribe to RSS Feed
- Permalink
- Report Inappropriate Content
Design a Self-Service Sheet
Dears,
in one of our QVWs, we need to provide a sheet that contains a blank chart in the middle, list of dimensions in the left and list of measures in the right.
So the user will be able to select the dimensions and it will be automatically used in the blank chart. The user will select the measures and they will be automatically used in the chart.
I know that this is applicable and we can do it by Qlik. i sow this design before, but I really want to know how i can implement it.
please if you have any sample that can show me the concept of how I can implement that please share it with me.
Accepted Solutions
- Mark as New
- Bookmark
- Subscribe
- Mute
- Subscribe to RSS Feed
- Permalink
- Report Inappropriate Content
- Mark as New
- Bookmark
- Subscribe
- Mute
- Subscribe to RSS Feed
- Permalink
- Report Inappropriate Content
- Mark as New
- Bookmark
- Subscribe
- Mute
- Subscribe to RSS Feed
- Permalink
- Report Inappropriate Content
One thing that I sometimes do is build this with $Field.
I have a list box for dimensions with $Field
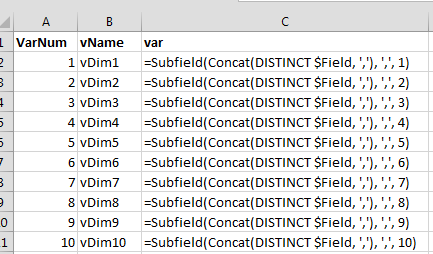
I setup variables 1 - however many needed with =Subfield(Concat(DISTINCT $Field, ','), ',', 1) for first $Field but I setup the variables in an Excel sheet because I can use the power of Excel to avoid having to manually create these variables where just the integer changes.
Then in the chart I use ='$(vDim1)', ='$(vDim2)'... with a condition to enable the dimension.
I read these vDIM1 variables from a spreadsheet because I can use a formula in Excel to change it quicker.
The Excel sheet looks like this:
- Mark as New
- Bookmark
- Subscribe
- Mute
- Subscribe to RSS Feed
- Permalink
- Report Inappropriate Content
Search the Community for documents/discussions about "Ad-hoc report". You will find a lot of them, all variations on a theme explained quite well by Jennell McIntire in Customizable Straight Table
Good luck,
Peter