Unlock a world of possibilities! Login now and discover the exclusive benefits awaiting you.
- Qlik Community
- :
- Forums
- :
- Archive
- :
- Archived Groups
- :
- Bug: Quadratic regression
- Subscribe to RSS Feed
- Mark Topic as New
- Mark Topic as Read
- Float this Topic for Current User
- Bookmark
- Subscribe
- Mute
- Printer Friendly Page
- Mark as New
- Bookmark
- Subscribe
- Mute
- Subscribe to RSS Feed
- Permalink
- Report Inappropriate Content
Bug: Quadratic regression
Hi Folks,
I was just trying to rebuild the coefficients of a Quadratic regression and i guess QV is not calculating them correctly!
The inbuild Polynomial Trendline (of 2nd degree) formula is not what i would expect.
Perhpaps somebody can confirm that this is a bug!
Please have alook at the attached sample
Im using QV V 11 .20. 12904.0 SR12 64-bit Edition.
Dirk Scharffetter, Jeffrey Goldberg, Mattias Malre Michael Tarallo
- Tags:
- Group_Discussions
Accepted Solutions
- Mark as New
- Bookmark
- Subscribe
- Mute
- Subscribe to RSS Feed
- Permalink
- Report Inappropriate Content
- Mark as New
- Bookmark
- Subscribe
- Mute
- Subscribe to RSS Feed
- Permalink
- Report Inappropriate Content
Not sure if there is a sample quadratic regression vs. population quadratic regression, but that could be one reason for the discrepancy. On the other hand, the fractile calculation within QlikView is also different compared to many options available online. It could very well be a case of one of the many options available to calculate the regression
This link is for sample and population regression (http://sites.stat.psu.edu/~rho/stat462/Chap14-MOS.PDF)
- Mark as New
- Bookmark
- Subscribe
- Mute
- Subscribe to RSS Feed
- Permalink
- Report Inappropriate Content
Hi Sunny,
thank you for your answer. Today i compared a lot of online regression tools and also loaded the data with R.
every tool had exactly the same result. I would expect QV to present the same result.
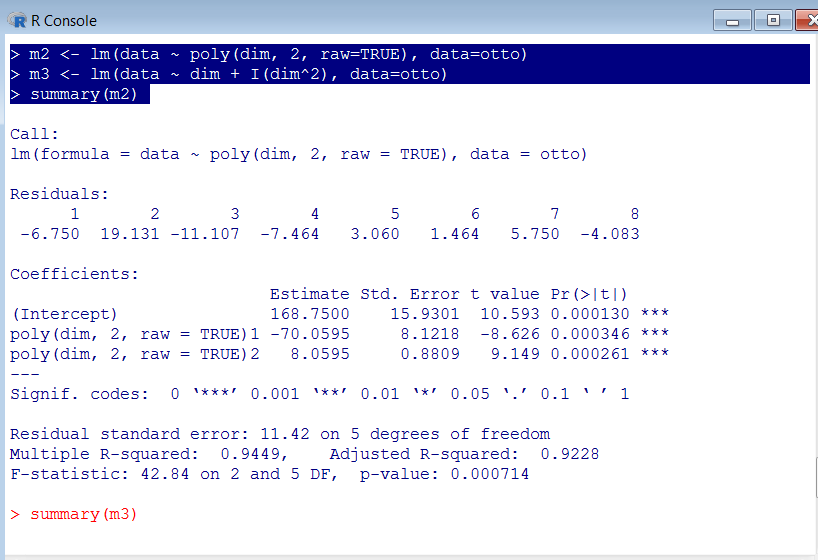
I guess QV is using the first bar (x=1) as intercept instead of x=0 because Y= A*1^2+B*1+C = 106,75.
( Y = 8,0595238095238 *1^2 -70,059523809524 * 1+ 168,75 = 106,75)
But inspite of that fact i have no clue where the -53,94 for B comes from!
very strange!!
- Mark as New
- Bookmark
- Subscribe
- Mute
- Subscribe to RSS Feed
- Permalink
- Report Inappropriate Content
Hmmm it is indeed strange... I have been out of touch with stats for a while... but you know how there is sample standard deviation which divides by N-1 instead of N. I was wondering if there is a similar thing for Regression where the mean is calculated using N-1 instead of N. I will have to dig to get more details about this, but a statistician might have a answer right away.
- Mark as New
- Bookmark
- Subscribe
- Mute
- Subscribe to RSS Feed
- Permalink
- Report Inappropriate Content
yes this might be the reason.
i just figured out that in case of increasing sample size the differences are getting smaller.
I will have a further look into it 🙂
- Mark as New
- Bookmark
- Subscribe
- Mute
- Subscribe to RSS Feed
- Permalink
- Report Inappropriate Content
Ya let us know what you find... I will be curious to know...
- Mark as New
- Bookmark
- Subscribe
- Mute
- Subscribe to RSS Feed
- Permalink
- Report Inappropriate Content
Change your bar chart to continuous axis.
![2017-08-04 16_35_32-QlikView x64 - [E__Users_Stefan_Downloads_Quadratic regression_2.qvw].png](/legacyfs/online/172526_2017-08-04 16_35_32-QlikView x64 - [E__Users_Stefan_Downloads_Quadratic regression_2.qvw].png)
- Mark as New
- Bookmark
- Subscribe
- Mute
- Subscribe to RSS Feed
- Permalink
- Report Inappropriate Content
Wow, thank you Stefan! So easy 🙂