Unlock a world of possibilities! Login now and discover the exclusive benefits awaiting you.

- Qlik Community
- :
- Forums
- :
- Archive
- :
- Archived Groups
- :
- IBM Cognos Chart Replica in Qlik getting Complex
- Subscribe to RSS Feed
- Mark Topic as New
- Mark Topic as Read
- Float this Topic for Current User
- Bookmark
- Subscribe
- Mute
- Printer Friendly Page

- Mark as New
- Bookmark
- Subscribe
- Mute
- Subscribe to RSS Feed
- Permalink
- Report Inappropriate Content
IBM Cognos Chart Replica in Qlik getting Complex
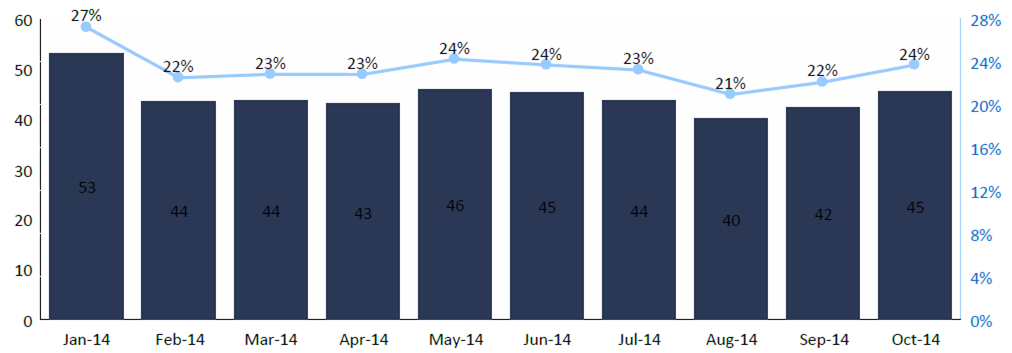
Dear Qlik Team, We have one chart in IBM cognos showing output like below -
It shows A/B as percentage
A (Current Assets)= (Opening Balance of Specific Ledger + Cumulative Transaction in a year till specified month)
B (Sale)= Cumulative Sales for Last 12 Months
In Qlik Sense,
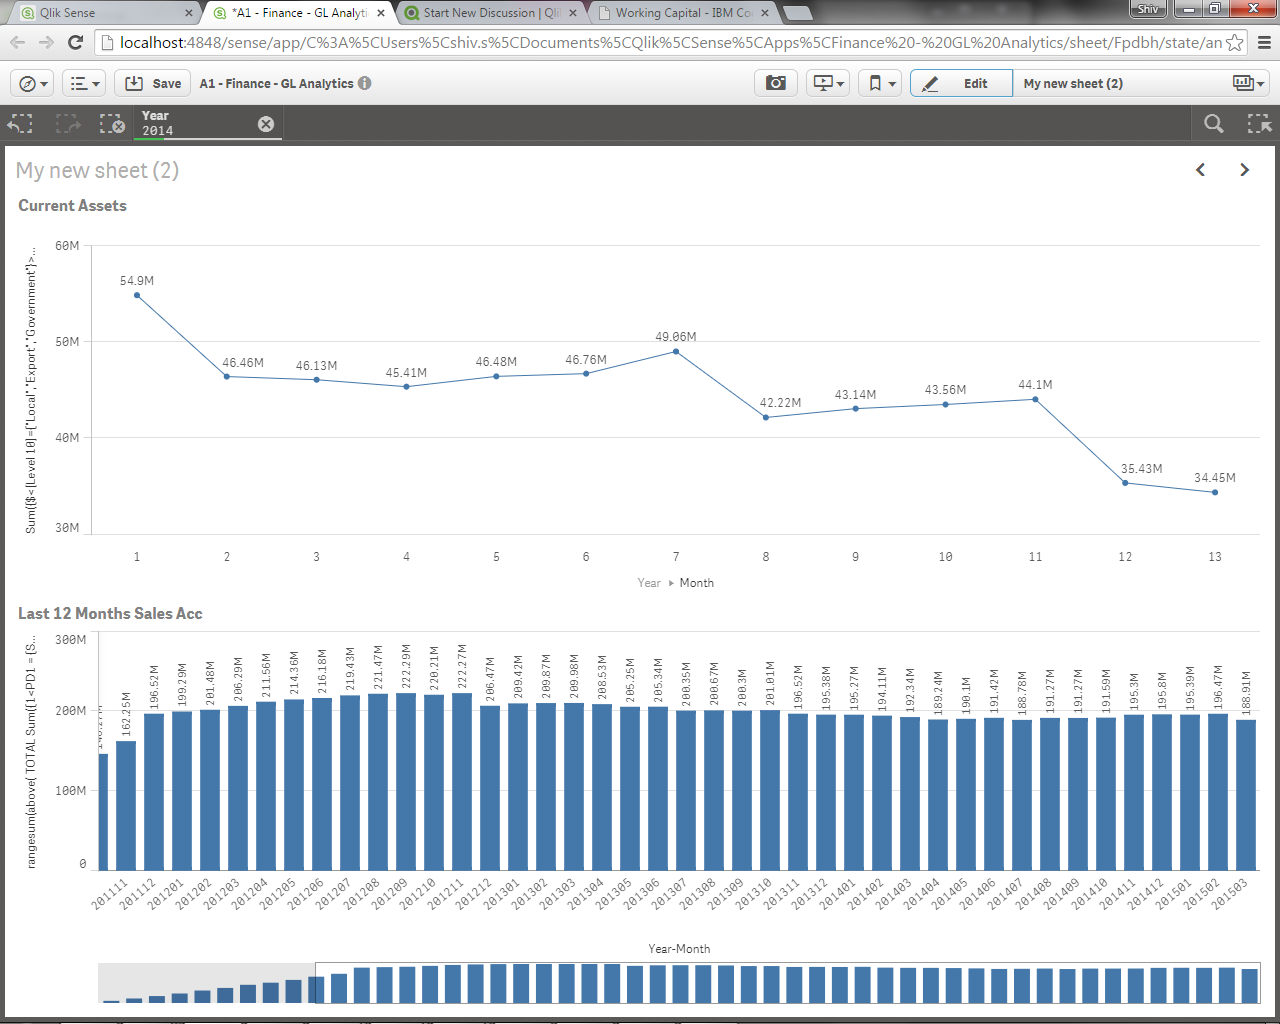
1- For calculating A, I am getting correct values against month dimension after selecting specific Year with below formula -
Sum({$<[Level 10]={"Local","Export","Government"}>}Openingb) +
rangesum(above( TOTAL Sum({$<[Level 10]={"Local","Export","Government"}>}Ballance1), 0, rowno(Total)))
2- For Calculating B, I am getting correct values against Year-Month Dimension with below formula -
rangesum(above( TOTAL Sum({1<PD1 = {Sales}>}Actual), 0, 12))
Now Problem -
1- Current Assets always totals within specific Year so I cant use Year-Month dimension to finally divide it to last 12 months sales in a single chart.
2- For last 12 months sales, I must use Year-Month dimension for rangesum funtion.
3- Rangesum makes the chart static (If i choose any dimension values are incorrect) which i don't want, as in Cognos it is dynamic, user can choose any specific month and gets the A/B %.
Can you please help to get rid of it, i need to join below two charts into one under one dimension as month or year.
In below snapshot for month 2, I want 46.46/194.11 = 23.93 % in final chart