Unlock a world of possibilities! Login now and discover the exclusive benefits awaiting you.
Product Innovation
By reading the Product Innovation blog, you will learn about what's new across all of the products in our growing Qlik product portfolio.
Support Updates
The Support Updates blog delivers important and useful Qlik Support information about end-of-product support, new service releases, and general support topics.
Qlik Academic Program
This blog was created for professors and students using Qlik within academia.
Community News
Hear it from your Community Managers! The Community News blog provides updates about the Qlik Community Platform and other news and important announcements.
Qlik Digest
The Qlik Digest is your essential monthly low-down of the need-to-know product updates, events, and resources from Qlik.
Qlik Learning
The Qlik Learning blog offers information about the latest updates to our courses and programs, as well as insights from the Qlik Learning team.
Recent Blog Posts
-
Creating apps on the fly
Some of you may remember that I recently posted about a similar topic here When do you post to Facebook?, where I talked about creating an app that allows users to authenticate with Facebook, grab their data with Facebook APIs, use halyard.js to generate a load script, and then create a session app. But when I did this just a few months ago, one of the things I really wished I could do was use the Visualization API so I could simply create cha... Show MoreSome of you may remember that I recently posted about a similar topic here When do you post to Facebook?, where I talked about creating an app that allows users to authenticate with Facebook, grab their data with Facebook APIs, use halyard.js to generate a load script, and then create a session app. But when I did this just a few months ago, one of the things I really wished I could do was use the Visualization API so I could simply create charts on the fly using Qlik Sense, but it wasn't possible then because a session app could not be created from or associated with the Capability APIs.
However, new APIs were introduced with Qlik Sense June 2017 that makes it possible to create apps on the fly using the Capability APIs, so now it is possible to create an app, load data, and create visualizations, all on the fly! This is made possible by the addition of some new methods to the Capability APIs, including the qlik.sessionApp method, the qlik.sessionAppFromApp method, the setScript method, and the getScript method.
There's already some pretty decent documentation for doing this at Qlik Sense Help - Creating apps on the fly, and I recommend you check that out, but I want to make everyone is aware of this very cool new capability of Qlik Sense June 2017, and just briefly address some issues you may run into.
First thing first, which is something I ran into while trying to create an example for this blog post -- anonymous users cannot create session apps, and this does not seem to be able to be controlled by security rules. Unless I'm missing something, it's entirely impossible. So, no anonymous users.
Next, there's been a few questions about just how to go about loading data. The simple answer is you need to set a load script using the setScript method, and then use the doReload method to load the data. But where do you get the load script from in the first place? Well you can use the getScript method on an app that already exists, or you can just write a script, though, of course, you'll need to also create the data connections you'll need somehow too if they don't already exist. And for many instances that I can think of where I would want to create an app on the fly, I'd use halyard.js. You could also create a session app from an existing app, get the load script from that app, and do some kind of search and replace on the load script which would custom tailor the data for the current user. The point is, there's a lot of possibilities, and it's really up to you and your use case how you want to go about this.
With being able to create apps, load scripts, and visualizations all on the fly, there's really a ton of potential to do some awesome stuff here. It would cool to hear about how some of you are using these capabilities!
-
Free Training!
Did you know that being a member of the Academic Program grants you a one-year FREE subscription of training through the Continuous Classroom, also known as the QCC?! The Continuous Classroom provides training videos, assessments, take away documents, quizzes and live instructor forums! Whether you are learning Qlik Sense or QlikView, the subscription offers both products so you can learn what you want, when you want! There is a variety of topi... Show More
Did you know that being a member of the Academic Program grants you a one-year FREE subscription of training through the Continuous Classroom, also known as the QCC?! The Continuous Classroom provides training videos, assessments, take away documents, quizzes and live instructor forums!
Whether you are learning Qlik Sense or QlikView, the subscription offers both products so you can learn what you want, when you want! There is a variety of topics included in the QCC from Data Literacy, to building visualizations, to storytelling!
To take advantage of this amazing deal visit the program and The Qlik Academic Program
and apply to the student or professor applications!

-
The Layers of Qlik GeoAnalytics
Qlik GeoAnalytics is known for its powerful mapping capabilities. I had the opportunity to dig down into the layers of Qlik GeoAnalytics when working on a project about Indian Migration. In this project, the team wanted to illustrate which states in India migrants moved to and left from. The plan was to show this on a map. Here were the requirements:Use color to show the selected state (the state users move to or from)Use color to show the nu... Show MoreQlik GeoAnalytics is known for its powerful mapping capabilities. I had the opportunity to dig down into the layers of Qlik GeoAnalytics when working on a project about Indian Migration. In this project, the team wanted to illustrate which states in India migrants moved to and left from. The plan was to show this on a map. Here were the requirements:
- Use color to show the selected state (the state users move to or from)
- Use color to show the number of migrants who moved
- Use arrows to show the direction of the move
- Place dots on each state that migrants move to or from
Here is a look at one of the resulting maps. In order to build it, we used 3 GeoAnalytic layers: the Area layer, the Bubble layer and the Line layer.
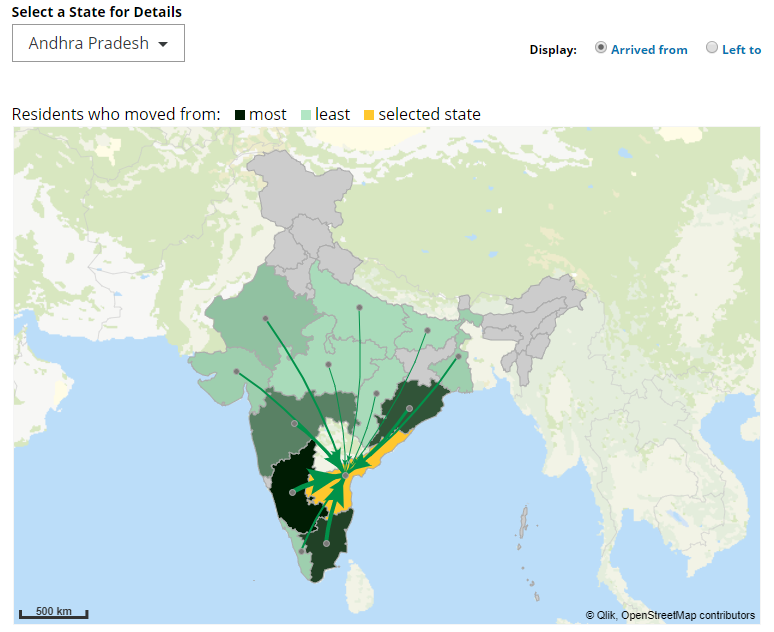
In the screenshot above, the selected state is Andhra Pradesh and it is highlighted in orange. All the states that migrants came from are colored in a shade of green using the ColorMix1 function. Darker shades of green indicate a larger number of migrants than the lighter shades of green.
Before we can begin to add the layers, we first had to add the GeoAnalytics Map to the app. Once this is done, the layers can be added. The first step was to use the Area layer to show which states users left from. The color expression (which you can see in the attached app) first checked for the selected state and colored it orange, then it checked for states where no one migrated from and colored them gray. The last part was to use the ColorMix1 function to color the states in shades of green based on the number of people who migrated from that state. The second step was to add dots or bubbles to the state. To do this the Bubble layer was used. The third step was to add the Line layer to illustrate the direction of the move. In the screenshot above, the arrows are all leading to the selected state, Andhra Pradesh. The width and size of the arrows are based on the number of migrants. The final few steps included using the Draw Order Adjustment property to indicate the order that we wanted the layers drawn – first the Area layer, then the Bubble layer and last the Line layer. We also made use of the Info Bubble so that we could provide informative data when users hover over an area, line or bubble.
Feel free to check out the attached app using Qlik Sense to see how all the pieces were put together. If you do not have Qlik Sense, you can download and try Qlik Sense Desktop for free from here. In this project, we only used 3 of the layers available with Qlik GeoAnalytics. There are other layers available as well as advanced geospatial information and geographic relationships. Learn more about Qlik GeoAnalytics and check out our Getting Started Videos.
Thanks,
Jennell
-
Replacing Null Values in Multiple Fields
In this week's Qlik Design Blog I am pleased to share some tips from our own Mitul Vadgama of our Qlik Consulting Services team. Mitul was recently working at a customer site when he noticed something that seemed a bit off when analyzing the customer's data. On the surface after loading the data everything appeared fine - but once they started performing selections, Mitul was able to identify the specific cause with the help of Qlik's Associativ... Show More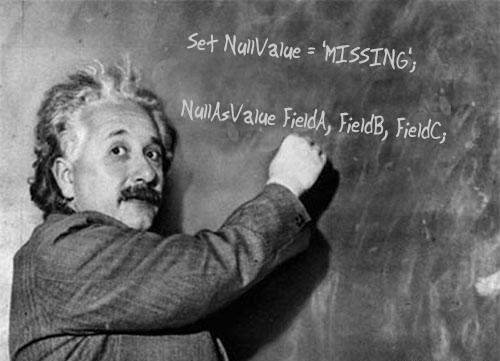 In this week's Qlik Design Blog I am pleased to share some tips from our own Mitul Vadgama of our Qlik Consulting Services team. Mitul was recently working at a customer site when he noticed something that seemed a bit off when analyzing the customer's data. On the surface after loading the data everything appeared fine - but once they started performing selections, Mitul was able to identify the specific cause with the help of Qlik's Associative Difference, the elusive <NULL> value.
The Problem
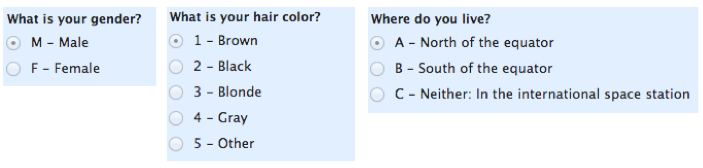
The customer's data model had about 300+ fields with a number of these fields being of a nominal data type (also known as categorical data). Put simply, I like to describe nominal data as the attributes in the data that don't carry a numerical value. Examples of nominal data are as follows:
Mitul found that when business users were selecting values in a nominal field it gave the correct result, however when they performed advanced selections such as using the the Select excluded option available in a select list, the results did not match up against what was expected. Thanks to Qlik's Associative Difference they were able to quickly and easily identify that <NULL> values were being excluded when the customer performed a Select Excluded selection. Yes, I know that sounds weird, the Select excluded option excluded <nulls> from the exclusion selection. (read-on and watch the quick video so this makes more sense to you
 )
)
Click to enlarge image
The Fix
One way is to use the NullValue variable and NullAsValue statement set in the Data Load Editor settings. (Qlik Help)
Syntax:
Set NullValue='<NULL>';
NullAsValue Field1, Field2;
In our example data we have <null> values in the StateProvince and OfficeStateProvince fields both in the Customers, and Employees tables. In the image above you can see that the <null> value is also not select-able in the filter pane.
Example:
Set NullValue='<Unknown>';
NullAsValue StateProvince, OfficeStateProvince;
After adding these settings to the Data Load Editor we were able to get the correct results as the <null> values were now being taken into consideration.

Click to enlarge image
Companion Video: Replacing Null Values in Multiple Fields
NOTE: To increase resolution or size of the video, select the YouTube logo at the bottom right of the player. You will be brought directly to YouTube where you can increase the resolution and size of the player window. Look for the 'settings' gears icon in the lower right of the player once at YouTube.
We hope this post has shown you another efficient way to handle <null> values in your Qlik application.
I'd like to thank Mitul for his valuable contribution to the Qlik Design Blog.
- For further reading on null handling check out this classic blog post by Henric Cronström:
https://community.qlik.com/docs/DOC-3155. - For a full list of services offered by Qlik Consulting check out: http://www.qlik.com/us/services/qlik-consulting.

About Mitul: Mitul is a member of our Qlik Consulting Services team in the UK. He has worked on a variety of consulting projects using both Qlik Sense and QlikView with many enterprise customers. His passion is transforming data into valuable business insights, knowledge sharing, and enabling customers to get the most value out of Qlik products.
Can't see the video?
Download the .mp4 and watch from your computer or mobile device.

- For further reading on null handling check out this classic blog post by Henric Cronström:
-
Student succeeds through the Academic Program!
Recently the Academic Program interviewed one of its student members to learn about their journey through the program and how it better prepared them for their career outside of the University. We interviewed a student named Nicole who joined the program from the University of South Florida while she was interning at SME, one of Qlik's partners. She was so successful at learning Qlik through the program and through her internship that she was ... Show More
Recently the Academic Program interviewed one of its student members to learn about their journey through the program and how it better prepared them for their career outside of the University. We interviewed a student named Nicole who joined the program from the University of South Florida while she was interning at SME, one of Qlik's partners. She was so successful at learning Qlik through the program and through her internship that she was offered a full time position after graduation and she now works as a Qlik Developer for SME. Shes also passionate about the program and she returns to her alma-mater often to promote the program and the use of Qlik in the classroom!
To read her story visit the latest blog about the Academic Program! Data Literacy for Everyone | Qlik
-
Master Items
One of my favorite features of Qlik Sense is the ability to create and reuse Master Items. Master Items (seen in the image on the left) are dimensions, measures and visualizations that have been saved in the Asset panel in a Qlik Sense app. During the development process, Master Items can be used to create visualizations and once the app is published, the Master Items are available in the Library panel (seen in the image on the right) for other... Show MoreOne of my favorite features of Qlik Sense is the ability to create and reuse Master Items. Master Items (seen in the image on the left) are dimensions, measures and visualizations that have been saved in the Asset panel in a Qlik Sense app. During the development process, Master Items can be used to create visualizations and once the app is published, the Master Items are available in the Library panel (seen in the image on the right) for others to use.
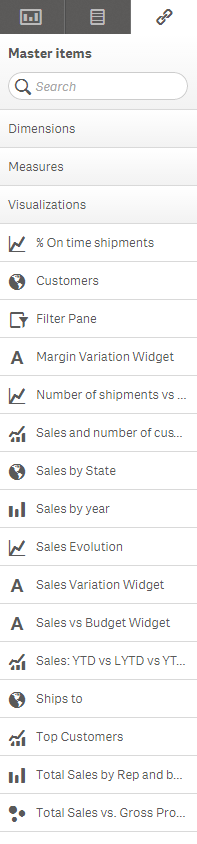
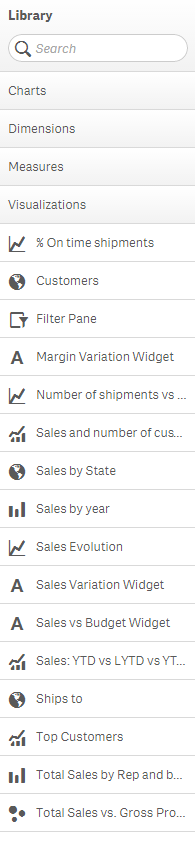
When creating apps, it is common to use the same dimensions and/or measure in more than one chart – that is why Master Items are so useful. I can create a Master Item measure such as Sales (Sum([Sales Amount])) and then use this measure in multiple charts. I do not need to copy and paste the measure every time I need to use it. All I need to do is drag it to my chart or select it from the list of measures. If I decide that I need to make a change to the measure, all I have to do is edit the measure in the Master Items and the change will be made anywhere the measure is used. This saves time and keeps the app/measures consistent. The same can be done with dimensions that are used often in an app. Create it once and use it wherever needed. The Asset panel also has an area for visualizations that can be created by the developer and saved giving users the ability to drag a pre-made visualization to their sheet. In this blog, I will focus on the dimensions and measures section of the Master Items.
There are a few ways you can create a Master Item. Let’s first take a look at how you can create a dimension. There are three ways you can create a dimension.
- From the Fields section in the Asset panel
- From the Master Items section in the Asset panel
- From the Data Model Viewer
For a closer look at how to create dimension, check out this documentCreating Dimensions and Measures.
Measure can be created in a similar way as the dimensions.
- From the Fields section in the Asset panel
- From the Master Items section in the Asset panel
- From the Data Model Viewer
For a closer look at how to create measures, check out this documentCreating Dimensions and Measures.
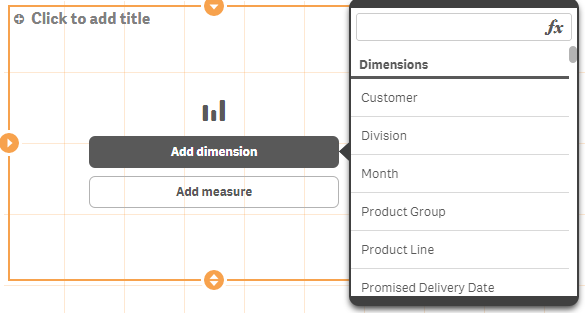
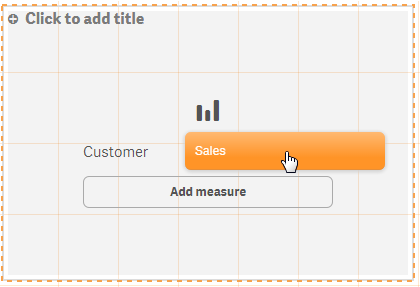
Once the dimensions and measures are created, they can be used to create visualizations. When you are prompted to add a dimension or a measure to a chart, the dimensions and measures that were added to the Master Items will be listed first.
Here is what you see when prompted to add a dimension:
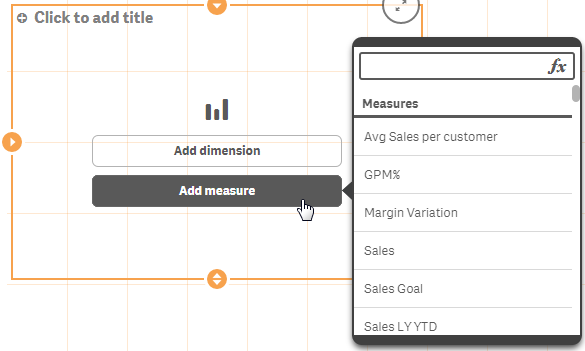
Here is what you see when prompted to add a measure:
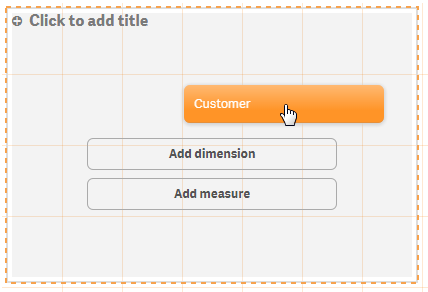
You can simply select the dimension/measure or you can drag the dimension/measure from the Master Items section to the chart.
Dragging Customer dimension to a bar chart:
Dragging Sales measure to a bar chart:
If you find the need to edit or change a dimension and/or measure, you can make the change in the Edit window and save. This change will be applied to all charts using the dimension and/or measure. So no more copying and pasting a measure change to all charts using the measure. This also ensures that the dimension and/or measure is updated consistently throughout the app.
Once the app is published, users can make use of the dimensions and measures in the Library to build their own visualizations or to edit existing visualizations. The user can drag and drop the dimensions and measures onto their charts and they do not need to worry about the expression or syntax because it is already done for them.
As you can hopefully see, it is very easy to add dimensions and measures to the Master Items and by taking the time to do so before creating your charts will prove to be quite valuable. Not only will it save you time when developing because of the reuse capabilities, it will aid you in creating a clean app that is consistent and easy to maintain. Once the app is published, it provides users self-service capabilities to build their own visualizations. If you do not create Master Items, I recommend you start. It is a great feature that in the end makes your job as the developer easier.
Thanks,
Jennell
-
Giving Data Meaning: Students Should Have A Say In What Analytics Tell You About...
When students interact with digital learning environments, they leave behind trails of data. The desire to understand and improve learning has led many educators to consider the value and utility of this information. But what can these data traces actually tell us about the students who left them, and how do we translate them into meaningful action?It is important to engage students in conversations about what data mean, and the implications of d... Show More
When students interact with digital learning environments, they leave behind trails of data. The desire to understand and improve learning has led many educators to consider the value and utility of this information. But what can these data traces actually tell us about the students who left them, and how do we translate them into meaningful action?
It is important to engage students in conversations about what data mean, and the implications of different interpretations.
Continued on EdSurge: Giving Data Meaning: Students Should Have A Say In What Analytics Tell You About Them | EdSurge News

-
A Historical Odyssey: QlikView 8, Ajax and Set Analysis
QlikView 7 was a great version – the Desktop, the Server and the Publisher all worked fine, but… they were not quite enterprise ready. It was not always simple to integrate all components in an already complex enterprise environment. So, for QlikView 8, one focus was to drastically improve the enterprise readiness. Hence, QlikView 8 brought us a a number of server components and functions: An html based control panel A built-in web server: P... Show MoreQlikView 7 was a great version – the Desktop, the Server and the Publisher all worked fine, but… they were not quite enterprise ready. It was not always simple to integrate all components in an already complex enterprise environment.
So, for QlikView 8, one focus was to drastically improve the enterprise readiness. Hence, QlikView 8 brought us a a number of server components and functions:
- An html based control panel
- A built-in web server: Previously it was necessary to have the Microsoft IIS installed.
- A Directory Services Controller: Previously it was possible to connect to the Microsoft AD only.
- QlikView Server authorization (DMS mode): Previously you could use the NTFS file system security only.
- Server clustering
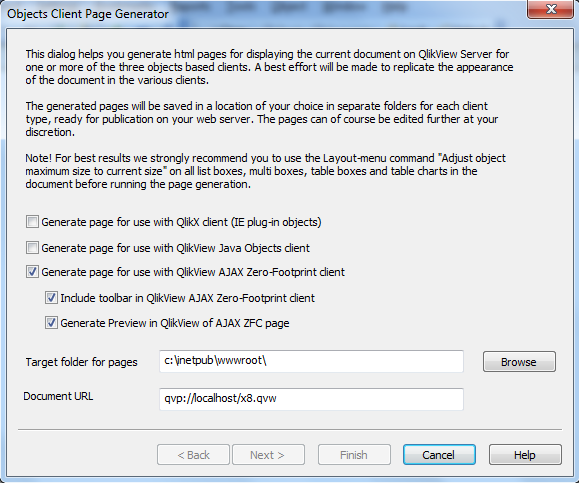
Another focus was on a light-weight, install-free client – the Ajax client. We had already started to experiment with this in the 7.5 version, but with QlikView 8 we launched it as one of our three basic clients: The C client (Desktop and Plug-In), the Java client and the Ajax client. The three clients had different capabilities – if you wanted full functionality, you chose the C client. On the other hand, there was some effort involved to install this, and if you wanted an install-free environment, you chose the Ajax client. The Java client was somewhere in between.
The Ajax client was however not as dynamic as it is today. The web pages had to be created in a manual step and posted on the web server.
We didn’t just add functionality; we also removed some: The Itanium processor had been launched some years earlier, and by now we had realized that its market share would not grow. So, for QlikView 8, we decided to discontinue the Itanium edition of QlikView.
QlikView 8 also brought the Advanced search, the Hierarchy resolution, the Input fields, the License lease and Set Analysis.

And, yes, we got the logo that we use still today.
Finally, QlikView 8 also brought us the first steps towards collaboration. It started with a simple function: the possibility to mail a link with a selection to someone else. We already had local bookmarks and now realized that it would not be practical to store an entire selection in a URL. Instead, we should of course store the bookmark on the server, and mail a link to this bookmark. From there, it was only a small step to expand this idea and allow the user to create and share other types of objects also.
QlikView 8 was, with the server components, the Set analysis and the collaboration a version that architecturally very much resembled today's QlikView.
Further reading on the Qlik history:
A Historical Odyssey: QlikView 7, QVD files and the Aggr() function

-
A Historical Odyssey: QlikView 5 and the Rainbow Border
Productwise, QlikView 5 was about consolidation. We did not change very much from QlikView 4. We already had a feature-rich product – now it was about improving the details and making it more stable. So we improved the functions in the UI – made it look nicer, introduced a layout menu and a layout undo, made it possible to copy and paste objects, introduced the current selections box, an input box, fast type change in charts, windows selecti... Show MoreProductwise, QlikView 5 was about consolidation. We did not change very much from QlikView 4. We already had a feature-rich product – now it was about improving the details and making it more stable.
So we improved the functions in the UI – made it look nicer, introduced a layout menu and a layout undo, made it possible to copy and paste objects, introduced the current selections box, an input box, fast type change in charts, windows selection style and fuzzy search. And we made it possible to export data to Excel.
We also improved the data loading capabilities. Now it became possible to load Unicode characters and HTML tables as well as XML files. It also became possible to load from SQL stored procedures. And the script editor was equipped with a debugger.
We developed the server further and made it more stable, but we really didn’t change much in the basic architecture.
None of the above was incredibly exciting or ground-breaking. Instead, QlikView 5 could perhaps be remembered for one less impressive feature: the rainbow border. This was probably one of the less useful features we have introduced. Whether it was beautiful, I leave to you to decide ....
During the lifetime of QlikView 5, Intel introduced a new, promising processor architecture: the Itanium, a 64-bit RISC processor for PCs. This was the future! With such a processor QlikView would no longer be limited by the 3GB restriction on the amount of data it could handle. This opened up a fantastic new opportunities! QlikView would be able to load much larger data amounts than before!
We immediately started to develop an Itanium edition of QlikView. As a consequence, the later releases of QlikView 5 were all compiled into both a 32 and a 64 bit edition. QlikView 5 therefore goes down in history as the first 64-bit version of the product (even though QlikView 6 was the first version where there was an official 64-bit version.)
As we developed QlikView 5 during year 2000, QlikTech got new investors which led to a change of management. When we released QlikView 5 in the spring of 2001, Måns Hultman had been appointed CEO.
Måns had a very clear picture of what the company needed: A refined sales strategy and a bigger sales force. The new sales strategy was simple: Focus. Rather than selling QlikView as a tool that could do anything, we would focus on financial applications on top of ERP systems, especially Movex (which was a common system in Sweden at that time). The target prospects were controllers and CFOs.
And it worked. With Måns’ new strategy and a good, stable QlikView 5, the company started growing faster than ever before. The course was set for becoming a public company.
Further reading on the Qlik history:
-
A Historical Odyssey: QlikView 4 and the first Server
QlikView 3 was a giant leap forward. More and more people started developing applications with QlikView and it became much easier to convince prospects and partners to join us on our journey. As a result we faced more and more demands from the real world: tools with which you can customize a document, tools for security, tools to save and re-use a selection, client/server, etc. Much of this didn’t exist in QlikView 3. So, for QlikView 4 we... Show MoreQlikView 3 was a giant leap forward. More and more people started developing applications with QlikView and it became much easier to convince prospects and partners to join us on our journey. As a result we faced more and more demands from the real world: tools with which you can customize a document, tools for security, tools to save and re-use a selection, client/server, etc. Much of this didn’t exist in QlikView 3.

So, for QlikView 4 we started to develop features based heavily on customer requirements.
We had already experimented a little with macros in QlikView 3 but in QlikView 4 we did it properly. We introduced the first color coding in pivot tables so that our customers could mark negative numbers red. We made it possible to activate several objects and align them. We made it possible to load Excel files. We introduced control structures such as For-Next loops in the script language. We introduced Section Access to address security demands. We introduced bookmarks. We introduced a proper NULL value handling and we introduced the text object, so that customers could show also static information.
We also had a new logo and a new icon.

But there are two features that, more than any others should be noted as the principal features in QlikView 4:
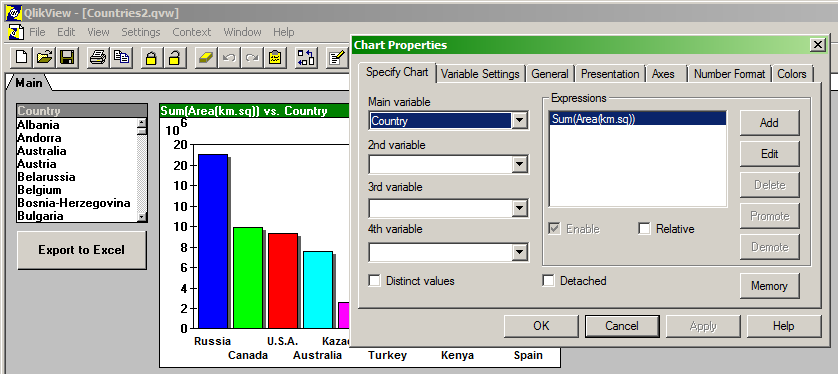
- The chart engine.
With QlikView 4, you could write any expression as an aggregation and QlikView would be able to evaluate it on the fly. This is true still today; you can have an expression with several arbitrary fields, where the fields reside in different tables, and then aggregate this expression. The aggregate can in turn be used in a new expression that uses other aggregations with fields from yet other tables, e.g., Sum(x*y)/Count(z). QlikView evaluates this expression correctly. This feature is unique to QlikView and is the core of one of QlikTech’s patents.
- The Server.
The second major advancement in QlikView 4 was the client-server capability. It was then called QlikView Web Solution. Compared to the QlikView Server of today, it was rudimentary. But it was a first step and some of the structure is still the same. Application development, then, was done just as it is today: on a standalone QlikView. The file could then be copied to the server. The only client that existed then was a Java client talking directly to the server. The server had to have Microsoft IIS (Internet Information Server) installed and the client had to have Microsoft Java installed. This meant that in practice we only supported Microsoft environments, both on the client and on the server side.
As I think back on it, it was really with QlikView 4 that we started our journey toward being an enterprise software product.
Further reading on the Qlik history:
A Historical Odyssey: QlikView 3
- The chart engine.
-
A Historical Odyssey: QlikView 2
Software development is a learning process. In the development you sometimes reach a point when you realize how you should have done it in the first place and as a consequence you want to re-write all or parts of the code from scratch. In 1996, when starting the development for QlikView 2, we were in such a situation. We had learned a lot from coding 32-bit Windows code (which was still fairly new) and we had seen that the older Single Document... Show MoreSoftware development is a learning process. In the development you sometimes reach a point when you realize how you should have done it in the first place and as a consequence you want to re-write all or parts of the code from scratch.
In 1996, when starting the development for QlikView 2, we were in such a situation. We had learned a lot from coding 32-bit Windows code (which was still fairly new) and we had seen that the older Single Document Instance (SDI) paradigm was not what we wanted to have in the future: SDI programs could only hold one document open at a time. We wanted the Multiple Document Instance (MDI) paradigm instead.
To make a long story short: We re-wrote large parts of the code and as a consequence, we had problems with the product stability. We had to postpone many of the planned features and spend time bug fixing instead.
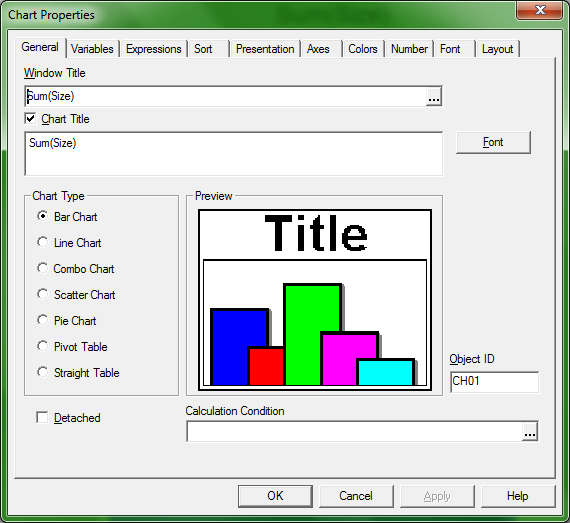
The features included in version 2.0 were hence few, the major ones being MDI interface, the introduction of the button object and the possibility to have several dimensions and several expressions in charts. With the button object you could e.g. export data to Excel.
And, yes, we discontinued the 16-bit version of QlikView. We saw that the future lay in 32-bit code. Also, and more specifically for QlikView, we saw that memory was getting cheaper and started realizing that it was possible to perform analysis down to the transactional level even for fairly large data sets – but for this we needed 32-bit code to be able to load the larger amounts of data.
After the release of version 2.0, we started working on the postponed features – and they were many! When we got closer to the release of 2.1, we noted that the new version would have little in common with the 2.0 version. So someone (from marketing) suggested we’d number the new version “2.5” instead.
Here you must understand that the QlikTech company culture contains a large element of frankness. If you don’t agree, you speak up; you say your meaning. So at the suggested jump from 2.0 to 2.5, there were people – techies including myself – that expressed their dissatisfaction over the inconsistent version numbering. An animated argument followed where no side got the upper hand. The people in favor of jumping to 2.5 were just as stubborn as we.
In these early days, such decisions were always made in consensus. But now we were in a deadlock. The compromise was to release neither a version 2.1 nor a version 2.5. Instead we labeled the new version “3.0”, which in retrospect was a good decision. But more about that in a later blog.
Bottom line is, that QlikView 2 had a very short lifetime and did not have a big impact at all. But it did pave the road for versions to come: We had re-written the code and the new 32-bit architecture was sound and allowed to be built further upon.
Further reading on Qlik history:
-
A Historical Odyssey: QlikView 1
1994 was the year when the Swedish soccer team took bronze in the world championships. It was also the year the channel tunnel opened. Boris Yeltsin was the Russian president and Bill Clinton was one year into his first term. 1994 was also the year when the first version of QlikView - or QuikView - was released. Version 1.0 had only the logical inference between fields – it had no graphics capabilities and no calculations were possible. But ... Show More1994 was the year when the Swedish soccer team took bronze in the world championships. It was also the year the channel tunnel opened. Boris Yeltsin was the Russian president and Bill Clinton was one year into his first term. 1994 was also the year when the first version of QlikView - or QuikView - was released.
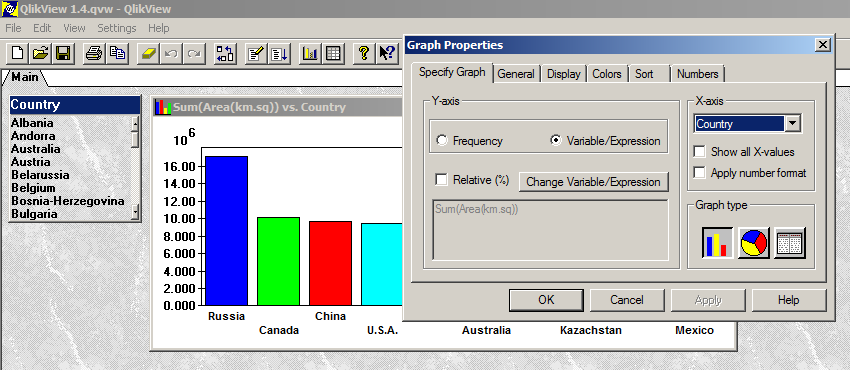
Version 1.0 had only the logical inference between fields – it had no graphics capabilities and no calculations were possible. But during the lifetime of QlikView 1 graphics and numeric calculations were added and by the release of version 1.42, QlikView had the same basic structure as we still have today: a multi-table relational data model, a logical inference engine, and graphs that hold no data of their own but instead are calculated on the fly based on the result of the logical inference.
Further, the conceptual idea of an “app” came with QlikView 1: the holy document. A QlikView document is in its basic form still today a self-contained file that holds all necessary information: a snapshot of data, layout information, and information on how the data should be refreshed. A user can have several documents, each corresponding to a specific area of the data. The document can be mailed to other users and no installation is necessary. This approach ensured portability and has been key to simplifying backward and forward compatibility as well as compatibility between QlikView Desktop and QlikView Server.
The mid nineties were also the time when 32-bit Windows software started to emerge. Most programs, as well as Windows 3.1 itself, were only 16-bit, but if you installed the Microsoft Win32s module, you could also run 32-bit programs. Consequently, several of the QlikView 1 releases were produced in both a 16-bit version and a 32-bit version. In 1995 Microsoft released Windows 95 and although we today are not very impressed by this operating system, it was at the time a big leap forward. After that, 32-bit programs became standard.
With the 16-bit QlikView you could only have 16,000 distinct values in a field and 65,000 records in a table. These limits were however not a huge problem because most of the analysis in those days was made on data sets with few distinct values and often with pre-aggregated data. By the introduction of the 32-bit QlikView, these limits were removed and this opened up the field for transactional analysis. It would take many years before the new limit of 2GB memory would become a problem.
Much of what was invented in QlikView 1 is still there today, in QlikView 11. In fact, the principal features from QlikView 1 are the core of the modern QlikView; they are the foundation of how QlikView still works today.
However, there is one thing from QlikView 1 that I miss – the marble background…
Further reading on the Qlik history:
A Historical Odyssey: Quality - Learning - Interaction - Knowledge
-
Take a look at Qlik Sense June 2017
Hey guys! - I'm very excited to introduce you to our latest release of Qlik Sense, June 2017. Yep - no version number or dots in this naming convention. With the announcement of our continuous release process discussed here, Qlik will begin releasing Qlik Sense every 10 weeks! Since each release will be similar in scope, we are also replacing our number-based naming convention with releases identified by the month and year they were distributed.... Show More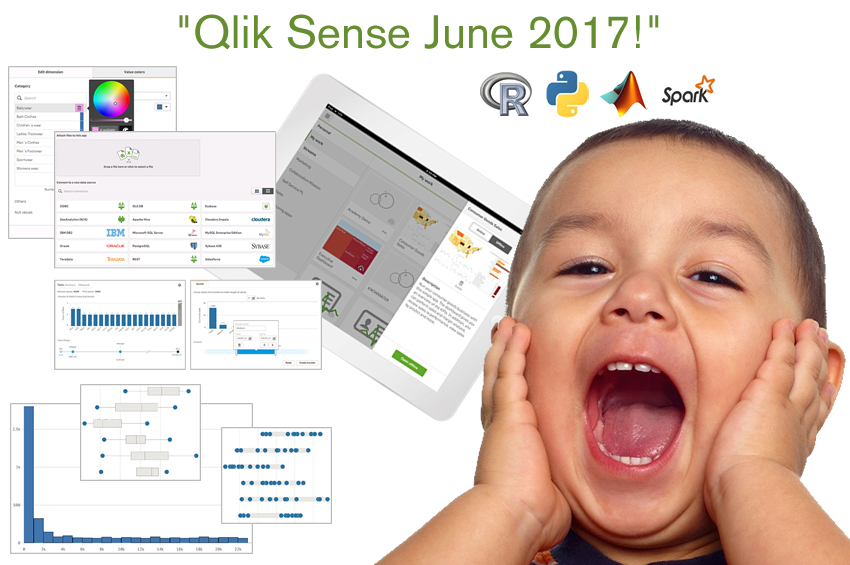
Hey guys! - I'm very excited to introduce you to our latest release of Qlik Sense, June 2017. Yep - no version number or dots in this naming convention. With the announcement of our continuous release process discussed here, Qlik will begin releasing Qlik Sense every 10 weeks! Since each release will be similar in scope, we are also replacing our number-based naming convention with releases identified by the month and year they were distributed. This means that instead of Qlik Sense 4.0, our June release is simply called Qlik Sense June 2017. (Most other Qlik products will also follow a similar cadence going forward as well.)
Currently customers and partners are invited to Join the Technical Preview and can get the latest software here. If you are not a customer or partner, our freemium product, Qlik Sense Desktop - will be available later in the month (UPDATE: available NOW here: Download Free Data Visualization Development Platform - don't forget you can always experience newer features before the software is available (such as the new data preparation features) without downloading any software by registering with Qlik Sense Cloud, thanks to our continuous release process.
There is so much goodness in this release that I don't want to create a giant text wall telling you about it. I created a brief summary video for your enjoyment as well as longer videos detailing and demonstrating the new features. You can view them at the video index below which include video files and samples. Please note that additional information on our Advanced Analytics integration is available in this community group Advanced Analytics Extensions and requires permission. Please send an email to mailto:insight@qlik.com to gain access. I am in the middle of working on a brief summary and "Hello World"-type video to demonstrate its concepts.
We want to hear from you, so please your comments and questions below!
Qlik Sense June 2017 - Highlights
The main video index for the Qlik Sense June 2017 Release and video .mp4 files and samples can be found here: Qlik Sense June 2017 - What's New
NOTE: To increase resolution or size of the video, select the YouTube logo at the bottom right of the player. You will be brought directly to YouTube where you can increase the resolution and size of the player window. Look for the 'settings' gears icon in the lower right of the player once at YouTube.
Regards,
-
From Zero to Qlik Hero
It’s a daunting task. You want to become the work hero, solving business analysis problems with efficiencies that make your company better. You want to go from not knowing much to being an in-house expert. But how do you get started? What can you do to really become proficient with software?To read the full blog visit From Zero to Qlik Hero | Qlik
-
Tuesday Tips and Tricks - On-Demand Report with NPrinting
Happy Tuesday everyone! - I have the pleasure of introducing our newest contributor to the Qlik Design Blog, Giuseppe Panella. I like to call him Gio! Gio has joined Qlik in 2015 after the acquisition of NPrinting by Qlik. He is now part of the Product Content and Media team as an interaction designer working on the production of videos for the Qlik Help channel managed on YouTube. Gio and I share the same love for video production at Qlik and wi... Show More
Happy Tuesday everyone! - I have the pleasure of introducing our newest contributor to the Qlik Design Blog, Giuseppe Panella. I like to call him Gio! Gio has joined Qlik in 2015 after the acquisition of NPrinting by Qlik. He is now part of the Product Content and Media team as an interaction designer working on the production of videos for the Qlik Help channel managed on YouTube. Gio and I share the same love for video production at Qlik and will be teaming up to bring you the latest news, features, capabilities and innovation from time to time via the Qlik Design Blog and other channels. Make sure to follow / subscribe to get the latest updates on our posted content. Gio is now producing a video series called Tuesday Tips and Tricks - with each short clip describing a particular capability across the Qlik product line. Today's clip shows you how to use a Qlik Sense extension available from Qlik Branch that enables Qlik Sense to provide an On-Demand Report capability in combination with NPrinting. (This capability is native in QlikView.) You can learn more about this feature here. http://branch.qlik.com/#!/project/58be6fc151be1c2744fb32a0 Future Tuesday Tips and Tricks will be promoted on the Qlik Design Blog from time to time and will also be made available in the Help Channel playlist. Enjoy!
Tuesday Tips and Tricks
NOTE: To increase resolution or size of the video, select the YouTube logo at the bottom right of the player. You will be brought directly to YouTube where you can increase the resolution and size of the player window. Look for the 'settings' gears icon in the lower right of the player once at YouTube.
Can't see the video? - You can download the attached .mp4 file to play on your computer or local device.
-
Implicit Set Operators
In Set expressions, an equals sign can be used to assign a selection to a field. But this is not the only assignment symbol that can be used. There are a couple of others. This post is about the alternative assignments symbols that can be used, and their respective use cases.Strictly speaking, the equals sign in set expressions is not an equals sign. Rather, it is an assignment symbol. This is the reason why you cannot use relational operators in... Show MoreIn Set expressions, an equals sign can be used to assign a selection to a field. But this is not the only assignment symbol that can be used. There are a couple of others. This post is about the alternative assignments symbols that can be used, and their respective use cases.
Strictly speaking, the equals sign in set expressions is not an equals sign. Rather, it is an assignment symbol. This is the reason why you cannot use relational operators in its place. The equals sign assigns a selection state to a field e.g.
{ $ <Country = {Sweden, Germany, 'United States'}> }
In this case, the element set ‘Sweden’, ‘Germany’, ‘United States’ is assigned as selection to the field “Country”.
But what if the set identifier already has a selection in the field “Country”?
In such a case, the old selection will be replaced by the new one. It will be like first clearing the old selection of the field, then applying a new selection.
However, this is not the only way to assign a set as selection in a field. You can also use assignments with implicit set operators. These will use the existing selection in the field to define a new selection:
Implicit Union:
{ $ <Country += {'United States'}> }
Note the plus sign.
This expression will use the union between the existing selection and ‘United States’ as new selection in the field, i.e. add the listed values to the previously select ones. The use case is not a common one, but it happens sometimes that you always want to show a specific country (or product or customer) as a comparison to the existing selection. Then the implicit union can be used.
Implicit Intersection:
{ $ <Country *= {"=Continent='Europe' "}> }
Note the asterisk.
This will use the intersection between the existing selection of countries and the countries in Europe as new selection in the field. (The search is an expression search that picks out European countries.) The set expression will not remove any part of the existing condition – instead it will just be an additional limitation.
This construction can in many cases be used instead of a normal assignment. In fact, it is often a much better solution than the standard assignment, since it respects the user selection and thus is easier to understand.
The implicit intersection should be used more.
Implicit Exclusion:
{ $ <Country -= {'United States'}> }
Note the minus sign.
This expression will use the existing selection, but exclude ‘United States’. The use case for an implicit exclusion is exactly this – you want to exclude a value. Hence, this construction is very useful.
Implicit Symmetric Difference:
{ $ <Country /= {'United States'}> }
Note the slash.
The above expression will select values that belong either to existing selection, or to the values in the set expression, but not to both. It’s like an XOR. I have never used this, and I would like to challenge the readers to come up with a relevant use case.
Bottom line: Assignments with implicit set operators are sometimes very useful. You should definitely consider using the implicit intersection and the implicit exclusion.
Further reading related to this topic:
-
How can Qlik Sense help you plan a party?
Summer BBQQlik Sense isnt just a business user tool, it can be used for so many fun purposes! Summer time is the time for outdoor fun and catching some sun. Its also a big time to host a BBQ, but how much money should you plan to spend for your next party?Visit the BBQ Qlik Sense app to help you determine how much money you need to host your party!
-
Coming Soon to Qlik NPrinting™
All products constantly evolve based on customer demand and technology Innovation and this is certainly what drives the Qlik NPrinting product team. When the first release of Qlik NPrinting (then Vizubi) was released in 2008 you would not have recognized the product as the one you know today. As we await the next release - scheduled for the end of June - we thought we would share what you might expect to find this time:Extension Support for Ql... Show More All products constantly evolve based on customer demand and technology Innovation and this is certainly what drives the Qlik NPrinting product team. When the first release of Qlik NPrinting (then Vizubi) was released in 2008 you would not have recognized the product as the one you know today.
 As we await the next release - scheduled for the end of June - we thought we would share what you might expect to find this time:
- Extension Support for Qlik NPrinting – The ability to include most third-party extensions in Qlik NPrinting reports.
- Metadata Reload Scheduling for Qlik NPrinting - Ability to schedule metadata reloads for Qlik NPrinting ensuring that developers always see the most recently built objects when building reports
- Various Qlik Nprinting™ API Enhancements
- User Selection State– Enhanced APIs to capture user selections and apply these to reports in Qlik NPrinting making On-Demand Reporting for Qlik Sense possible. (This capability already exists in QlikView as a plug-in.)
- Management - ability to build, modify and delete users, distribution groups and filters via the API which supports the management of users based on external systems.
- Task Execution – ability to filter and run a Qlik NPrinting report distribution to multiple users based on an external scheduler or trigger.
- Task & Connection Monitoring - Real-time task monitoring for Qlik NPrinting Administrative functionality which allows administrators to see Qlik NPrinting activity in real time.
What’s Cooking @ Qlik
This information and Qlik‘s strategy and possible future developments are subject to change and may be changed by Qlik at any time for any reason without notice. This information is provided without a warranty of any kind. The information contained here may not be copied, distributed, or otherwise shared with any third party.
Qlik NPrinting 17 was virtually a complete rewrite of the Qlik NPrinting product as the Vizubi team became more integrated into the Qlik family. As the year goes on, the feature gap between Qlik NPrinting 16 and Qlik NPrinting 17 will continue to narrow. Of course, new capabilities will surface as well.
Just a few of the items that we are evaluating over the coming months/year are:
- Ability to Promote/Demote a report in order to move it from development to production
- Additional feature parity between capabilities across QlikView and Qlik Sense
- Updated Rendering Service
The investments that we have made in Qlik NPrinting 17 over the past year position us well for the year to come and beyond. We are looking forward to this being a great year for Qlik NPrinting 17 and its users!

-
Qlik NPrinting June 2017 is now available!
The Qlik NPrinting June 2017 is now available from our Customer Download SIte. Capabilities include:Extension Support for Qlik NPrinting – The ability to include most third-party extensions in Qlik NPrinting reports.Metadata Reload Scheduling for Qlik NPrinting - Ability to schedule metadata reloads for Qlik NPrinting ensuring that developers always see the most recently built objects when building reportsVarious Qlik Nprinting™ API Enhancement... Show MoreThe Qlik NPrinting June 2017 is now available from our Customer Download SIte.
Capabilities include:
- Extension Support for Qlik NPrinting – The ability to include most third-party extensions in Qlik NPrinting reports.
- Metadata Reload Scheduling for Qlik NPrinting - Ability to schedule metadata reloads for Qlik NPrinting ensuring that developers always see the most recently built objects when building reports
- Various Qlik Nprinting™ API Enhancements
- User Selection State– Enhanced APIs to capture user selections and apply these to reports in Qlik NPrinting making On-Demand Reporting for Qlik Sense possible. (This capability already exists in QlikView as a plug-in.)
- Management - ability to build, modify and delete users, distribution groups and filters via the API which supports the management of users based on external systems.
- Task Execution – ability to filter and run a Qlik NPrinting report distribution to multiple users based on an external scheduler or trigger.
- Task & Connection Monitoring - Real-time task monitoring for Qlik NPrinting Administrative functionality which allows administrators to see Qlik NPrinting activity in real time.
Other related announcements -
- Support Blog Announcement including release notes - Qlik NPrinting June 2017 is now available
- Prior announcement including active discussion with the product manager - Coming Soon to Qlik NPrinting™
-
Qonnections Keynote Now Available
It is hard to believe that more than a month has passed since we returned to the office from Qonnections, our annual partner & customer conference. The event is a lot like a family reunion and it was fantastic to see everyone as well as the level of enthusiasm and engagement.If you weren't able to join us, you can now find the keynote from Qonnections on the event site. I wanted to also share it here because the keynote is squarely focused on ... Show MoreIt is hard to believe that more than a month has passed since we returned to the office from Qonnections, our annual partner & customer conference. The event is a lot like a family reunion and it was fantastic to see everyone as well as the level of enthusiasm and engagement.
If you weren't able to join us, you can now find the keynote from Qonnections on the event site. I wanted to also share it here because the keynote is squarely focused on the three key innovation themes that we have set for ourselves over the coming year. These themes include - Hybrid Cloud, Big Data Indexing, and Augmented Intelligence.
P.S. We have already begun planning for next year's Qonnections event. So, please feel free to share ideas about what you think would make a great event.


