Unlock a world of possibilities! Login now and discover the exclusive benefits awaiting you.
Product Innovation
By reading the Product Innovation blog, you will learn about what's new across all of the products in our growing Qlik product portfolio.
Support Updates
The Support Updates blog delivers important and useful Qlik Support information about end-of-product support, new service releases, and general support topics.
Qlik Academic Program
This blog was created for professors and students using Qlik within academia.
Community News
Hear it from your Community Managers! The Community News blog provides updates about the Qlik Community Platform and other news and important announcements.
Qlik Digest
The Qlik Digest is your essential monthly low-down of the need-to-know product updates, events, and resources from Qlik.
Qlik Learning
The Qlik Learning blog offers information about the latest updates to our courses and programs, as well as insights from the Qlik Learning team.
Recent Blog Posts
-
Introducing Conversational Analytics in Microsoft Teams
This past week we released an exciting new AI capability – Qlik conversational analytics in Microsoft Teams. With the new Qlik app for Teams, you can easily chat with Insight Advisor, Qlik's intelligent AI assistant, to explore data using natural language directly within Teams. Users can now ask questions through individual or group chat and Qlik will respond with AI-generated data visualizations and insights, using data from across your Qlik a... Show MoreThis past week we released an exciting new AI capability – Qlik conversational analytics in Microsoft Teams. With the new Qlik app for Teams, you can easily chat with Insight Advisor, Qlik's intelligent AI assistant, to explore data using natural language directly within Teams. Users can now ask questions through individual or group chat and Qlik will respond with AI-generated data visualizations and insights, using data from across your Qlik apps. Because it's Microsoft Teams, you can collaborate with others in real-time, collectively making decisions using the insights generated by Qlik. And with the Teams mobile app, you have access to Qlik Analytics on-the-go, for insights at the point of decision.
-
Upgrade advisory for Qlik Replicate 2024.5: Known issues
Edit 17th September 2024: Added Oracle-to-Oracle bidirectional tasks issueEdit 9th November 2024: Replaced expired links A set of problems were identified in the Qlik Replicate 2024.5 release and actively addressed. If you are planning to upgrade or have already done so and are seeing unexpected behavior, please review the highlighted knowledge articles for details: Qlik Replicate 2024.5 and DB2i Source Endpoint leads to conversion errors with NU... Show MoreEdit 17th September 2024: Added Oracle-to-Oracle bidirectional tasks issue
Edit 9th November 2024: Replaced expired linksA set of problems were identified in the Qlik Replicate 2024.5 release and actively addressed.
If you are planning to upgrade or have already done so and are seeing unexpected behavior, please review the highlighted knowledge articles for details:
Qlik Replicate 2024.5 and DB2i Source Endpoint leads to conversion errors with NUMERIC Datatype
After an upgrade to Qlik Replicate 2024.5, capturing changes (CDC) for a Table defined on a DB2i Source leads to conversion errors with the NUMERIC Datatypes with precision and scale greater than zero.
To mitigate, upgrade to 2024.5 SP03 (GA). Download it here (expires: 1/31/2025).Read more here.
Qlik Replicate 2024.5 Upgrade SAP HANA Trigger Version 1 migrates to Version 3 CTS Mode
As a part of a Qlik Replicate upgrade to 2024.5, SAP HANA Source Endpoints using Version 1 configuration are converted to Version 3 CTS Mode.
To mitigate, upgrade to 2024.5 SP03 (GA). Download it here (expires: 1/31/2025).
Read more about the available workaround here.Qlik Replicate 2024.5 GA Build 144: Store Changes using the new use_manipulation_pk_for_apply Option
With Store Changes (see Change Processing) turned on for CDC tasks, Qlik Replicate tasks may crash or stop unexpectedly with the new feature use_manipulation_pk_for_applyenabled.
To mitigate, upgrade to 2024.5 SP03 (GA). Download it here (expires: 1/31/2025).
Read more about the available workaround here.Qlik Replicate tasks crash due to changes to the redo log format after installing Oracle July 2024 patch on Oracle 19
Qlik Replicate tasks using Oracle as a Source Endpoint fail after installing the Oracle July 2024 patch.
To mitigate, upgrade to 2024.5 SP03 (GA). Download it here (expires: 1/31/2025).
Read more about the issue here.Qlik Replicate 2024.05 and Oracle-to-Oracle: Bidirectional Tasks fail after upgrade
Oracle-to-Oracle bidirectional tasks fail after an upgrade to Qlik Replicate 2024.05. The tasks crash without an error or start failing with a duplicate constraint error on the attrep_loopback_prevention table.No workaround or solution is yet available. Qlik will provide a timeline for a patch at the end of September 2024.
Read more about the issue here.Don't hesitate to contact us if you have any questions or concerns about the upgrade. We will monitor this blog post for your queries.
Thank you for choosing Qlik,
Qlik Support -
1:1 Private Session with Expert Arthur Fantaci!
We have announced exclusive bonuses for those who signed up for the first Predictive Analytics with Qlik AutoML course: Bonus #1: A discount of 30% Bonus #2: Access to an extra live session with our expert Arthur Fantaci But there’s still one more exciting surprise, and we’re sure you’re going to love it! Remember, the first session is on November 13th. Sign up now! -
WhatsApp for Qlik Answers
WhatsApp for Qlik Answers DataGlow IT WhatsApp for Qlik Answers gives you the power to converse with Qlik Answers assistants in a completely open and conversational way through WhatsApp. Discoveries Able to immediately interrogate Qlik Answers Assistants directly through WhatsApp. No browser or direct Qlik access needed! Impact Huge impact in customer service scenarios where it is not always possible to get a laptop out and inter... Show MoreWhatsApp for Qlik AnswersDataGlow IT WhatsApp for Qlik Answers gives you the power to converse with Qlik Answers assistants in a completely open and conversational way through WhatsApp.
Discoveries
Able to immediately interrogate Qlik Answers Assistants directly through WhatsApp. No browser or direct Qlik access needed!
Impact
Huge impact in customer service scenarios where it is not always possible to get a laptop out and interact with Qlik Answers natively. Great example is a field engineer that needs to request how to repair a particular model.
Audience
WhatsApp is a great option where mobility is an important part of the role. Also a preferred tool for those who are not "dashboard savvy" and don't want to have to log in and access systems to gain important insights on their unstructured data.
Data and advanced analytics
Inclusive access to Qlik Answers through secured Qlik APIs. Instant notification and convenience using WhatsApp.
-
Dissecting the New UI: Insights
In this blog we take an in-depth look at the first section of the new UI: Insights. -
Announcing a new Qlik Academic Program contact in the Americas!
I’m Brittany Fournier, the new Academic Program Project Manager at Qlik for the Americas and I wanted to say hello and tell you a bit about myself. -
New Addition to Automations: Chart image support
Distribute chart images through Qlik Application Automation -
Handling Multiple Languages
Today’s corporate environment is global. QlikView application developers are required to support many regions and many languages. So how does a QlikView application developer handle multiple languages? Well, that depends on how the data is captured and the overall goal of the application developer. Let’s look at two scenarios.Scenario 1: The developer only needs to translate the labels and textboxes within the application and not the actual dat... Show MoreToday’s corporate environment is global. QlikView application developers are required to support many regions and many languages. So how does a QlikView application developer handle multiple languages? Well, that depends on how the data is captured and the overall goal of the application developer. Let’s look at two scenarios.
Scenario 1: The developer only needs to translate the labels and textboxes within the application and not the actual data.
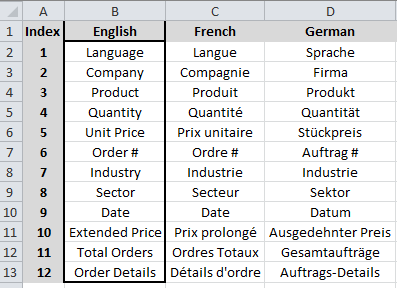
- Create a translation spreadsheet that contains an index column to be used for reference and columns for every language that each label and text entry that needs to be translated.
- Fill in the English language column with the text to be translated and have translators fill out their language.
- In the script load the translation spreadsheet and create an inline table that contains all of the language translations. Then create a variable, say vDataLanguage, that reads the Language field.
- Using set analysis, create an expression that references the index number and the language to display
=Only({<Index={12}>} [$(=vDataLanguage)])
for all textbox and object captions that need to be translated.
Scenario 2: The data from which the QlikView application developer is developing is recorded in English but he/she needs to have some of the actual data translated into other languages.
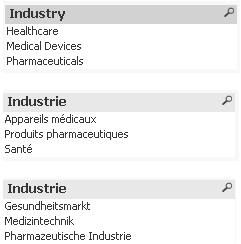
- The first thing that he/she needs to do is determine the fields that need to be translated and create a translation spreadsheet that contains a worksheet for each of the fields to be translated. For example, we need to translate the Industry data. Now we need to load the data translation file into QlikView as a Mapping Load for each language. For this example we need to translate into German and French so we’ll create a mapping file for French_Industry and a mapping file for German_Industry.
- Create an inline table that contains all of the language translations.
- Create a variable that reads the Language field (vDataLanguage).
- In the script, find the Industry Field that we need to translate. Using the Applymap function we can translate the English data into the different languages and be sure to name the translated field as Fieldname_Language (e.g. Industry_French) .
- We now need to create a variable for each translated field. So for industry we’ll create vIndustry. The expression in vIndustry is
=chr(91)&'Industry' &chr(95) & '$(vDataLanguage)' & chr(93) . - Now to get the correct language to display in a list box you need a calculated dimension using this expression, which is
=$(vIndustry).
That’s it! Easy, right? Well, it is a bit time consuming if you are trying to translate data in fields but translating text and labels is really not that difficult. I created a technical overview that walks you through the two scenarios mentioned in this blog as well as a third scenario which can be found here. This resource includes a How-To, sample data files and 2 QVWs.
Good luck with the translations! Lycka till med översättningarna! 翻訳で頑張ってください!

-
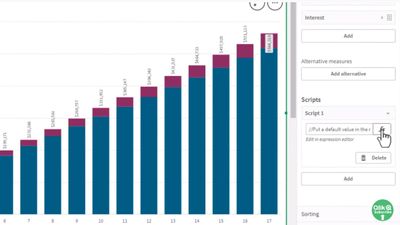
Chart Level Scripting - Use Cases, Samples and Examples
I love this new capability - Chart Level Scripting! This takes generating insights to a whole new level. No longer am I required to write complex reporting frameworks or move complex logic to the backend data model. Read on!
-
Qlik Sense Enterprise for Windows - New Security Patches Available Now
Edited August 30th, 15:55 CET: Added clarification on older Qlik Sense Enterprise on Windows versionsEdited August 31st, 13:10 CET: Added clarification on possible workarounds (none exist) as well as information regarding what authentication methods (all) are affected and that HTTP and HTTPS are impactedEdited November 21st, 8:40 CET: Added clarification to apply the latest patches Hello Qlik Users, Two security issues in Qlik Sense Enterprise fo... Show MoreEdited August 30th, 15:55 CET: Added clarification on older Qlik Sense Enterprise on Windows versions
Edited August 31st, 13:10 CET: Added clarification on possible workarounds (none exist) as well as information regarding what authentication methods (all) are affected and that HTTP and HTTPS are impacted
Edited November 21st, 8:40 CET: Added clarification to apply the latest patchesHello Qlik Users,
Two security issues in Qlik Sense Enterprise for Windows have been identified and patches made available. Details can be found in Security Bulletin Critical Security fixes for Qlik Sense Enterprise for Windows (CVE-2023-41266, CVE-2023-41265).
This announcement from August 2023 and the mentioned releases only cover CVE-2023-41266 and CVE-2023-41265. Apply the most recent patches as documented in Critical Security fixes for Qlik Sense Enterprise for Windows (CVE-2023-48365) (September 2023), which resolve CVE-2023-48365 as well.
Today, we have released five service releases across the latest versions of Qlik Sense to patch the reported issues. All versions of Qlik Sense Enterprise for Windows prior to and including these releases are impacted:
- May 2023 Patch 3
- February 2023 Patch 7
- November 2022 Patch 10
- August 2022 Patch 12
All prior versions of Qlik Sense Enterprise on Windows are affected, including releases such as May 2022, February 2022, and earlier. While no patches are currently listed for these versions, Qlik is actively investigating the possibility of patching older releases.
No workarounds can be provided. Customers should upgrade Qlik Sense Enterprise for Windows to a version containing fixes for these issues. August 2023 IR released today already contains the fix.
- August 2023 Initial Release
- May 2023 Patch 4
- February 2023 Patch 8
- November 2022 Patch 11
- August 2022 Patch 13
This issue only impacts Qlik Sense Enterprise for Windows. Other Qlik products including Qlik Cloud and QlikView are NOT impacted.
All Qlik software can be downloaded from our official Qlik Download page (customer login required). Follow best practices when upgrading Qlik Sense.
The information in this post and Security Bulletin Critical Security fixes for Qlik Sense Enterprise for Windows (CVE-2023-41266, CVE-2023-41265) are disclosed in accordance with our published Security and Vulnerability Policy.
Clarifications and Frequently Asked Questions:
What can be done to mitigate the issue?
No mitigation can be provided. An upgrade should be performed at the earliest. As per Qlik's best practices, the proxy should not be exposed to the public internet, which reduces the attack surface significantly.
What authentication methods are affected?
All authentication methods are affected.
Are environments with HTTP disabled impacted?
Environments will be affected regardless if HTTP or HTTPS are in use. These vulnerabilities affect the HTTP protocol overall, meaning even if HTTP is disabled, the environment remains vulnerable.
These attacks don’t rely on intercepting any communication, and therefore, are indifferent whether the HTTP communication is encrypted or not.
Kind regards, and thank you for choosing Qlik,
Qlik Global Support
-
Expert Arthur Fantaci Joins the First Qlik AutoML Session!
Last week, we announced a 30% discount for those who signed up for the first Predictive Analytics with Qlik AutoML course (13 November). Now, we’re thrilled to announce the second bonus that will make the first edition of the course something you won’t want to miss. -
Connector Factory - August & September 2024 releases
For August & September 2024, Connector Factory has released more connectors for data integration, data analytics and application automation. -
Social networks analysis
Social networks analysisActium DigitalThis application is used Instagram, Twitter and Google analytics. Folowers, posts and visits.DiscoveriesYou can analyze visits to your web, views to you instagram profileImpactYou can review impact on your posts.AudienceMarketing peopleData and advanced analyticsYou can check most visited pages on your web -
Learning from hackathons is the new trend
In recent times, there have been hackathons being organised by colleges on various topics and technologies. Clearly, there is a big interest from students and professors to organize such events. One of the key reason is that the academic community feels that this is a great way to learn and engage the student community. According to digit.in, there are several benefits of a hackathon and they are as follows: 1. Learning a new technical skill 2. ... Show MoreIn recent times, there have been hackathons being organised by colleges on various topics and technologies. Clearly, there is a big interest from students and professors to organize such events. One of the key reason is that the academic community feels that this is a great way to learn and engage the student community.
According to digit.in, there are several benefits of a hackathon and they are as follows:
1. Learning a new technical skill2. Creating a sense of accomplishment
3. Enhancing your soft skills
4. Beefing up your resume
5. Networking
6. Paving the path for a start up
7. Getting inspired
8. Giving back to the community
9. Winning a prize
10. Having fun
One of Qlik's academic partners, ICT Academy's CEO, Mr V Srikanth, mentioned in a recent article in The Times of India, that Learning based on Hackathon is the way forward.
The Qlik Academic Program has collaborated for three hackathons ( datathons) this year with Anurag Engineering College, Hyderabad, Kristu Jayanti College, Bangalore and the third one coming up with VJIT Hyderabad. There has been a good amount of participation in all these events. Students are more engaged, they are able to present their outcomes and get feedback on their creations from experts.
Overall, this is a win win for everyone and in some cases, prospective employers are able to gauge the skills of students from an event and offer opportunities. This way, hackathons have many benefits and are clearly a great way to engage students and make them industry ready.
For information on the Qlik Academic Program and to find out the resources including training and certifications for students and professors, please visit: qlik.com/academicprogram
-

-
2022 Qlik Sense Product Certifications now open for Registration!
The 2022 Qlik Sense product certifications are now open for registration with the first exam date of December 14, 2022. Visit our certifications page to register for Qlik Sense certification exams today for the best choice of appointment times!
-
Not another Qlik Sense Spotify App - no really!
This is an interesting and fun way to showcase not only Qlik Sense's Associative Difference and visualization features, but actually shows you a sample flow from problem to solution that we can all relate to; finding that next music track / artist to listen to.
-
REST connector: Using WITH CONNECTION
See what WITH CONNECTION can do for you when working with REST data sources
-
The Revolution of Machine Learning: First Qlik AutoML Course with Limited- time ...
Register this week for our new course Predictive Analytics with Qlik AutoML and get 30% off (use code CLASSROOM30 at checkout)!
-
Use of a Silent Legend
In this blog post, I will revisit a topic that I blogged about over a decade ago, the use of a silent legend. By default, a legend is created in a visualization when there are multiple dimensions and/or measures. The legend helps the user understand the visualization. Legends are helpful and without them, users may not comprehend the data in a visualization. But what do you do if have many visualizations on a sheet? Do you need a legend for each ... Show MoreIn this blog post, I will revisit a topic that I blogged about over a decade ago, the use of a silent legend. By default, a legend is created in a visualization when there are multiple dimensions and/or measures. The legend helps the user understand the visualization. Legends are helpful and without them, users may not comprehend the data in a visualization. But what do you do if have many visualizations on a sheet? Do you need a legend for each chart? Let’s look at the various ways a legend can be used and how a silent legend can reduce the clutter and give a sheet a cleaner look.
In the screen shot below, there are four visualizations at the bottom of the sheet with legends.
In this app, the legends are all the same because the visualizations are using the same asset class dimension. A master item is used for the asset class dimension. This allows the colors for each dimension to be set in one place for consistency throughout the app.
In this example, the legend does not need to be displayed for each visualization because it is redundant. Let’s see how this sheet will look if only one of the legends are kept on the sheet. A legend can easily be removed by toggling off Show Legend in the properties of the chart.
Here is what the sheet looks like with just one legend.
The sheet looks better with one legend versus four legends. This use of one legend for four charts, has decluttered the sheet and reduced repetitiveness. If a developer wants a legend to be displayed without expanding the chart, they need to ensure the visualization is large enough. Without the legends in the three stacked bar charts, less space is needed for the charts, thus they can be made smaller, if desired, to take up less space on the sheet. Since all the visualizations at the bottom of the sheet are using the same legend, the legend was placed with the first visualization, assuming a user is reading top to bottom, left to right.
Now, the beauty of a silent legend is that all visualization legends can be removed from a sheet. In the screenshot below, the four headings at the top of the sheet are colored based on the asset class they represent. So, Equity is green, Fixed Income is dark blue and so on.
This is an example of silent legend. The legend is implied by the asset class headings. This option looks even better and cleaner than the sheet with one legend.
The use of a silent legend is possible in this app because there are only four values for asset class. I have seen this work nicely with up to six values. Anything more may become too cumbersome and may require a legend to be used. Also, if the four visualizations at the bottom of the sheet used different dimensions, then multiple legends should be used. Legends are important and they should not be removed to add space if the chart is unreadable without it. What good is a pretty chart if you do not understand it.
Thanks,
Jennell