Unlock a world of possibilities! Login now and discover the exclusive benefits awaiting you.
Product Innovation
By reading the Product Innovation blog, you will learn about what's new across all of the products in our growing Qlik product portfolio.
Support Updates
The Support Updates blog delivers important and useful Qlik Support information about end-of-product support, new service releases, and general support topics.
Qlik Academic Program
This blog was created for professors and students using Qlik within academia.
Community News
Hear it from your Community Managers! The Community News blog provides updates about the Qlik Community Platform and other news and important announcements.
Qlik Digest
The Qlik Digest is your essential monthly low-down of the need-to-know product updates, events, and resources from Qlik.
Qlik Learning
The Qlik Learning blog offers information about the latest updates to our courses and programs, as well as insights from the Qlik Learning team.
Recent Blog Posts
-
Learn your way. Save your way!
Are you ready to take your Qlik skills to the next level? Then we have got exciting news for you! -
Seamless Public Data Sharing with Qlik's New Anonymous Access Capability
As organizational accountability and transparency requirements grow, sharing data and analytics insights with the public is no longer just a "nice to have"—it’s a competitive advantage. For businesses, it helps build trust and showcase expertise. For governments and institutions, it fosters accountability and transparency. Today, Qlik launched a new capability that enables you to seamlessly and securely share public data with any visitor to your ... Show MoreAs organizational accountability and transparency requirements grow, sharing data and analytics insights with the public is no longer just a "nice to have"—it’s a competitive advantage. For businesses, it helps build trust and showcase expertise. For governments and institutions, it fosters accountability and transparency. Today, Qlik launched a new capability that enables you to seamlessly and securely share public data with any visitor to your site or portal—without requiring them to log in to access apps, reports, or dashboards.
-

-
Inject AI into your Databricks Qlik Talend Cloud Data Pipeline
Discover Qlik Talend Cloud Data integration Pipelines with Databricks AI functions -
Quizz App
Quizz App Quizz Quizz application, I used Qlik questions that I found in my Chest (“laughs”), for the purpose of illustrating the application only. It brings an approach serving as a basis for those who want to create an application with choice questions. File is available at qvf for download Discoveries This application will guide you in the construction of a questionnaire, with selection questions for correct or incorrect choices ... Show MoreQuizz AppQuizz Quizz application, I used Qlik questions that I found in my Chest (“laughs”), for the purpose of illustrating the application only. It brings an approach serving as a basis for those who want to create an application with choice questions. File is available at qvf for download
Discoveries
This application will guide you in the construction of a questionnaire, with selection questions for correct or incorrect choices
Impact
Agility in creating a questionnaire, Save time spent Ease of use. Of course, as I said, these are simple applications that require adjustments to achieve better results, but this is a starting point for your construction.
Audience
Education and related areas HR
Data and advanced analytics
The data composes questions, alternatives and templates
-
New Security capability in Talend 8.0.1 - Native JWT Token Validation
In Patch Release 8.0.1 R2024-07 Talend introduced native product support for JWT (JSON Web Token) validation. This new functionality significantly enhances security by enabling OIDC (OpenID Connect) / OAuth2 integration with REST services developed in Talend Studio. With the introduction of JWT token validation, Talend now supports modern, robust security integrations. This allows for seamless authentication using external identity providers lik... Show MoreIn Patch Release 8.0.1 R2024-07 Talend introduced native product support for JWT (JSON Web Token) validation. This new functionality significantly enhances security by enabling OIDC (OpenID Connect) / OAuth2 integration with REST services developed in Talend Studio. With the introduction of JWT token validation, Talend now supports modern, robust security integrations. This allows for seamless authentication using external identity providers like Azure Entra ID or Keycloak, empowering users to authenticate against these providers and retrieve a signed JWT token tied to a specific service
-
【オンデマンド配信】The AI Reality Tour Tokyo ダイジェスト
去る 10月 2日(水)に開催しました「The AI Reality Tour Tokyo」 では、データの世界で起きている AI の現実に焦点を当て、Qlik の最新の AI イノベーションや先進的なユーザー事例をご紹介しました。 本 Web セミナーでは、特別ゲストと Qlik のエグゼクティブによるパネルディスカッション、3 社の日本企業による先進的な事例をお届けします。 ※本 Web セミナーは、2024年 10月 2日(水)開催の「The AI Reality Tour Tokyo」 における一部の講演を録画したものです。※参加費無料。パソコン・タブレット・スマートフォンで、どこからでもご視聴いただけます。今すぐ視聴する 【開催概要】日時:オンデマンド配信講演企業:富士通株式会社 / Snowflake 合同会社 / QTnet 株式会社 NEC パーソナルコンピュータ株式会社 / SEGA 今すぐ視聴する -
Welcome to the exciting world of Qlik Application Automation!
Register now for our new course Qlik Application Automation and get 30% off (use code CLASSROOM30 at checkout)! -
New: Efficiently Manage Your Local Qlik Cloud Analytics Data Files with Enhanced...
Experience the convenience of a smarter, more efficient file management system today! We have introduced our new Enhanced File Management feature in Qlik Cloud—making organization effortless. Now you can seamlessly structure your uploaded and cloud-generated files into directories and subdirectories, giving you full control over your data. With batch actions like move, copy, cut, and paste, managing multiple files has never been easier or faster.... Show MoreExperience the convenience of a smarter, more efficient file management system today!
We have introduced our new Enhanced File Management feature in Qlik Cloud—making organization effortless. Now you can seamlessly structure your uploaded and cloud-generated files into directories and subdirectories, giving you full control over your data.
With batch actions like move, copy, cut, and paste, managing multiple files has never been easier or faster. Streamline your workflow, reduce clutter, and stay organized with just a few clicks.
This feature has been rolled out in the following regions as per:
- Oct 7th (Mon): SE+JP+UK - 14:00 CET/08:00 ET
- Oct 9th (Wed): DE+SG+AP - 14:00 CET/08:00 ET
- Oct 14th (Mon): US - 15:00 CET/09:00 ET
- Oct 16th (Wed): EU 14:00 CET/08:00 ET
In this blog post we will cover:
- Where to access the folder structure
- Create folder hierarchies and organize files into them
- Perform bulk operations on files and folders
- Reference space folder structure in Sense app and script development
- LOAD statements in the load script
- Store statements
- Inserting QVS code
- Documentation
Where to access the folder structure
The new features are accessible in your Data files menu for each space.
- First, navigate to your Space and click Space Details
- Choose Data files
- You'll now have access to additional options, such as creating, copying, or deleting folders
Create folder hierarchies and organize files into them
Each space (Personal, Shared, Managed, and Data) in Qlik Cloud Analytics contains its own structure of folders organized in a hierarchical fashion. Data files can be organized in nested folder structures. For example, within your personal space, you might want to have separate folders for Order Data and Budget Data.
The location of a file or folder within a space is shown in its path. The path uses / symbols to represent when a folder is nested within other folders.
For example, suppose within your personal space, you have separate folders for Order Data and Budget Data. If you have a data file named Orders_2024_December.QVD in your Order Data folder, this file would be located in the following folder path within your personal space:
Personal/Order Data
Perform bulk operations on files and folders
Files and folders can be moved to different spaces or locations within the same space. You can also move multiple items at a time using the Cut and Paste actions, either from the menu or through keyboard shortcuts (CTRL-C, CTRL-V, CTRL-X).
Reference space folder structure in Sense app and script development
LOAD statements in the load script
When you use files in spaces to add data to apps and scripts, the folder location in the space is referenced and required.
Examples: Reference to file at the top-level path of a space
This example loads the file orders.csv from a personal space. The file is not located within any specific folder but sits at the top-level path in the space.
LOAD * FROM [lib://DataFiles/orders.csv];
This example loads the file orders.csv from a shared, managed, or data space. The name of the space is TeamSharedSpace. The file is not located within any specific folder but sits at the top-level path in the space.
LOAD * FROM [lib://TeamSharedSpace:DataFiles/orders.csv];Examples: References to specific folder path within a space
This example loads the file orders_Europe.csv from the folder Orders By Region within a personal space.
LOAD * FROM [lib://DataFiles/Orders By Region/orders_Europe.csv];
This example loads the file orders_Europe.csv from the folder Orders By Region within a shared, managed, or data space. The name of the space is SalesSpace.
LOAD * FROM [lib://SalesSpace:DataFiles/Orders By Region/orders_Europe.csv];
Store statements
When you add a Store statement to store data from a load script into Qlik Cloud Analytics, the folder location in the space is referenced and required.
Example: Storing file at the top-level path of a space
In this example, the entire table mytable is exported into Qlik Cloud Analytics as a file named myfile.qvd. The file is added to the shared space TeamSharedSpace. The file is not located within any specific folder but sits at the top-level path in the space.
Store * from mytable into [lib://TeamSharedSpace:DataFiles/myfile.qvd];
Example: Storing file to a specific folder path within a space
In this example, the entire table mytable is exported into Qlik Cloud Analytics as a file named myfile.qvd. The file is added to the folder SalesData within the space TeamSharedSpace.
Store * from mytable into [lib://TeamSharedSpace:DataFiles/SalesData/myfile.qvd];
Inserting QVS code
When inserting QVS code into a load script, the folder location in the space is referenced and required.
Example: Referencing QVS file at the top-level path of a space
In this example, the file test.qvs is referenced in the load script. The file is located in the space TeamSharedSpace. The file is not located within any specific folder but sits at the top-level path in the space.
$(Must_Include=lib://TeamSharedSpace:DataFiles/test.qvs)
Example: Referencing QVS file in a specific folder path within a space
In this example, the file test.qvs is referenced in the load script. The file is located in the folder SalesData within the space TeamSharedSpace.
$(Must_Include=lib://TeamSharedSpace:DataFiles/SalesData/test.qvs)
Documentation
The Qlik Cloud Documentation has been updated with comprehensive information about the new feature.
- Managing data files
- Adding datasets from local files
- Inserting QVS code from spaces in Qlik Cloud Analytics
- Storing files to spaces in Qlik Cloud Analytics
- Loading files from spaces in Qlik Cloud Analytics
Thank you for choosing Qlik,
Qlik Support -
Talend 7.3.1 Reaches End of Support
Talend 7.3.1 Reaches End of Support Talend version 7.3.1, released in February 2020, will reach the end of support on November 30, 2024, as detailed in the Talend Product Documentation. After this date, Talend version 8 will be the only regularly supported version of the Talend Platform. What are the options for Talend 7.3.1 customers? If you are currently using Talend version 7.3.1 in a mission-critical production environment, we encourage y... Show MoreTalend 7.3.1 Reaches End of Support
Talend version 7.3.1, released in February 2020, will reach the end of support on November 30, 2024, as detailed in the Talend Product Documentation. After this date, Talend version 8 will be the only regularly supported version of the Talend Platform.
What are the options for Talend 7.3.1 customers?
If you are currently using Talend version 7.3.1 in a mission-critical production environment, we encourage you to consider one of the following options:
- Transition to fully supported Talend 8 and purchase Talend 7.3.1 Limited Extended Support. We realize that you might need more time to migrate to Talend 8, so this option includes a limited Talend 7.3.1 support offering, covering one additional 13-month period ending December 31, 2025.
- Transition to fully supported Talend 8 only. Talend 8 includes many features and improvements that enhance your productivity and efficiency, not to mention that upgrading to a supported version helps ensure that your software stays relevant, secure, and usable for years to come. You can continue operating Talend 7.3.1, but it will not be supported by Qlik.
Note: Every active Talend subscription is entitled to a current Talend version 8 license. If you do not already have a Talend 8 license, please contact Qlik Customer Support via the customer portal to request one. Active subscriptions with renewal dates before December 30, 2025, can also buy the Talend 7.3.1 Limited Extended Support offer if needed.
Frequently Asked Questions
This knowledge article provides answers to the frequently asked questions that customers have posed about the End-of-Support for Talend 7.3.1.
Next Steps
For renewal and purchase information, contact the following:
- If you purchased Talend 7.3.1 from a Talend or Qlik Partner, please contact that Partner to discuss pricing and options.
- If you purchased Talend 7.3.1 directly from Talend or Qlik, please contact your Qlik Talend representative directly or via email at sales@qlik.com.
Finally, for all other upgrade and troubleshooting information, contact Qlik Customer support at https://customerportal.qlik.com/.
-
-
Release Cadence Update: Qlik Sense Enterprise Client-Managed
Beginning with the May 2024 release, Qlik Sense Enterprise Client-Managed will release two major releases a year (May and November). This adjustment aligns our release cycle with the preferred cadence of our customers, enhancing communication around our major releases. Qlik continues to add new functionality to Qlik Sense Client-Managed versions following their initial release to the cloud. As always, we will continue to deliver patches as need... Show MoreBeginning with the May 2024 release, Qlik Sense Enterprise Client-Managed will release two major releases a year (May and November).
This adjustment aligns our release cycle with the preferred cadence of our customers, enhancing communication around our major releases. Qlik continues to add new functionality to Qlik Sense Client-Managed versions following their initial release to the cloud. As always, we will continue to deliver patches as needed under our Release Management Policy.
We look forward to helping you optimize your release experience. Be sure to follow the release notes area in Qlik Community and review our updated policy.
-
Unlock Scalable, Secure and Effortless Public Data Sharing with Qlik Anonymous A...
Imagine making Qlik content available to the public without requiring users to log in. And now imagine no more and get started with Qlik Anonymous Access, a feature we hope you are as excited about as we are. Qlik Anonymous Access will strengthen your community, drive engagement, and help you unlock the full potential of your public data. See our full Innovation blog here. The Highlights Making data available to the public is one thing—making... Show MoreImagine making Qlik content available to the public without requiring users to log in.
And now imagine no more and get started with Qlik Anonymous Access, a feature we hope you are as excited about as we are. Qlik Anonymous Access will strengthen your community, drive engagement, and help you unlock the full potential of your public data.
See our full Innovation blog here.
The Highlights
Making data available to the public is one thing—making it easy to access and consume is another. This is where Qlik’s Anonymous Access shines. By allowing users to interact with dashboards without a login, Qlik simplifies data access for a broad audience, allowing:
-
No Barriers to Entry: Any website visitor can navigate and explore interactive dashboards and reports without login
-
Inclusive Data Access: This simplifies access, ensuring that a broader audience, from policymakers to concerned citizens, can engage with the data.
-
Seamless Embedding: Qlik’s dashboards, apps, and sheets can be embedded into web portals, transforming static reports into interactive, easily navigable experiences.
-
Continuously up to date: Qlik Anonymous Access provides automatic refresh, keeping the information current.
-
Interactive Engagement: Dashboards allow users to filter, explore, and interact with data, fostering deeper understanding and insights.
-
Empowering Conversations: Encourages meaningful discussions by directly providing real-time, actionable insights through intuitive, dynamic tools.
-
Centralized Knowledge Hub: Embedding Qlik dashboards into internal and public portals creates a unified space for information and decision-making.
-
Security: The security feature, defaulted to "not allowed," prevents unauthorized public data sharing, enhancing security when sharing with anonymous users. To enable it, you must create a custom role, set the scope to "allowed," and assign it to authorized users or groups.
-
Enhanced Accessibility: The cloud allows users to access public data from anywhere, making it easier for communities and organizations to engage with the information.
How to get started
Anonymous Access is controlled at the app level. Users with the correct permissions can turn anonymous access on and off as needed. These users can also configure access code settings, as well as view and copy links and codes that provide anonymous access.
- How to get started: Sharing app content with anonymous access
- Using Anonymous Access with qlik-embed: Anonymous Access with qlik-embed
Subscriptions and Offerings
With a Qlik Anonymous Access subscription, you create an anonymous access tenant in Qlik Cloud. The cloud infrastructure is hosted and managed by Qlik. In an anonymous access tenant, the user experience is very similar to other Qlik Cloud subscriptions. The main differences are assignment of user entitlement by administrators, limitations on using certain add-on capabilities, and capacities for data loading and app development.
See Qlik Anonymous Access subscriptions for details.
Thank you for choosing Qlik,
Qlik Support -
-
What does the TOTAL qualifier do?
@What does the TOTAL qualifier do when used in a chart expression? I have used TOTAL in an expression when I want to perform an aggregation across all dimensions. For instance, if I need to show the percentage of employees in a specific office in a KPI object, I would use the TOTAL qualifier in an expression like this:I would sum the number of employees in the Paris office and divide that by the total number of employees across all offices. In... Show More@What does the TOTAL qualifier do when used in a chart expression? I have used TOTAL in an expression when I want to perform an aggregation across all dimensions. For instance, if I need to show the percentage of employees in a specific office in a KPI object, I would use the TOTAL qualifier in an expression like this:

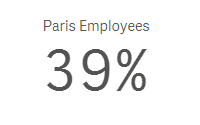
I would sum the number of employees in the Paris office and divide that by the total number of employees across all offices. In this expression, TOTAL disregards the dimension value (which is City in this case) and adds all employees. Now if I make a selection in my app and select Paris, then my KPI would change to 100% because the total is based on the possible field values. To get around this, I can add set analysis to the expression to look at the data before any selections were made. The expression would look like the expression below and would remain 39% even if city selections are made.

I often use the TOTAL qualifier in KPI objects when I need to highlight a value but it can be used in any chart expression. In the pivot table below, you can see how an expression value can differ with the use of TOTAL.
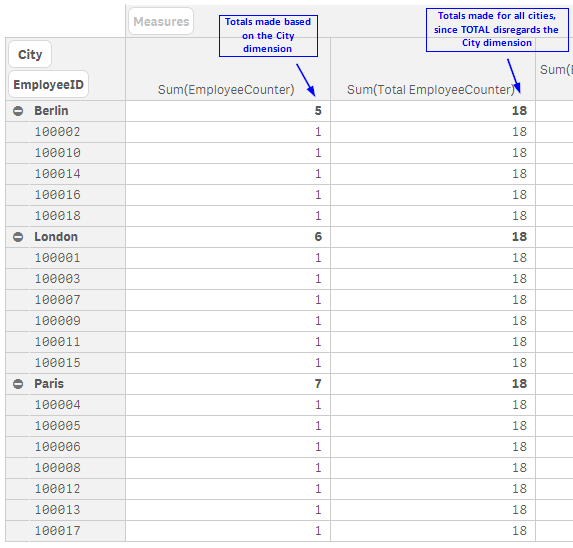
The TOTAL qualifier is useful when you want to see the shares of something similar to when you use a pie chart to see the percentage of parts that make up the whole. In my case, it is helpful when I want to see the shares without making a selection first. Henric Cronstrom wrote a great blog on The Aggregation Scope which talks about this topic is more detail.
Thanks,
Jennell
-
Introducing the New Layout Container - Tips, Tricks, Nuances
This week I’m kicking off the holiday season with a gift that gives you new ways to create content and design dashboards in Qlik Analytics, our new layout container object.
-
-
Under the Hood of Qlik Cloud Data Services and Hybrid Data Delivery
I would be lying if I said that I wasn’t excited and a little nervous about our new release today because it’s been a while in the making. Months of planning and development have led to this point that truly marks a major event in both Qlik’s transformational journey to the cloud and for the next chapter in our data management strategy. Today our first data service is now generally available. WOOT! Show MoreI would be lying if I said that I wasn’t excited and a little nervous about our new release today because it’s been a while in the making. Months of planning and development have led to this point that truly marks a major event in both Qlik’s transformational journey to the cloud and for the next chapter in our data management strategy. Today our first data service is now generally available. WOOT!
-
Sales Dashboard
Sales DashboardPredoole Aanalytics Pvt LtdThe purpose of the sales dashboard is to provide a comprehensive overview of key sales metrics, enabling decision-makers to monitor performance, identify trends, and take strategic actions. The app consolidates data related to sales revenue, customer insights, and performance indicators to ensure informed decision-making. Value of the Dashboard: Real-time Decision-Making: Access to up-to-date sales data a... Show MoreSales DashboardPredoole Aanalytics Pvt LtdThe purpose of the sales dashboard is to provide a comprehensive overview of key sales metrics, enabling decision-makers to monitor performance, identify trends, and take strategic actions. The app consolidates data related to sales revenue, customer insights, and performance indicators to ensure informed decision-making. Value of the Dashboard: Real-time Decision-Making: Access to up-to-date sales data allows for quick adjustments in strategy. Improved Sales Performance: By tracking key metrics, teams can optimize their efforts and improve overall sales productivity. Customer Retention and Growth: The dashboard provides insights into customer trends, helping improve retention and grow customer base. Strategic Planning: Helps in forecasting and long-term business planning through detailed revenue and performance insights.Discoveries
Data Visualization Increases Decision-Making Speed: Visual representations of data make it easier for users to identify patterns, trends, and anomalies. Customer Segmentation Boosts Revenue: Understanding customer segments—such as top customers by revenue, region, or purchase behavior—enables more targeted sales and marketing strategies.
Impact
Salesperson Performance Metrics Increase Accountability: Clear performance tracking improves accountability, encouraging higher productivity and goal achievement. Management can easily identify top performers and areas needing coaching or development.
Audience
Sales Managers/Team Leads: Role: Responsible for overseeing the performance of the sales team, tracking key performance indicators (KPIs), and managing the sales pipeline. Need: They use the dashboard to monitor team performance, identify bottlenecks, track conversion rates, and take corrective actions if needed.
Data and advanced analytics
Improved Sales Forecasting and Planning Impact: Predictive analytics, powered by historical data, enables accurate sales forecasting, identifying potential revenue streams, future sales volumes, and market demands.
-
Techspert Talks - Qlik Cloud Reporting Evolution
Hi everyone, Want to stay a step ahead of important Qlik support issues? Then sign up for our monthly webinar series where you can get first-hand insights from Qlik experts. The Techspert Talks session from October looked at Qlik Cloud Reporting Evolution. But wait, what is it exactly? Techspert Talks is a free webinar held on a monthly basis, where you can hear directly from Qlik Techsperts on topics that are relevant to Customers and Partner... Show MoreHi everyone,
Want to stay a step ahead of important Qlik support issues? Then sign up for our monthly webinar series where you can get first-hand insights from Qlik experts.
The Techspert Talks session from October looked at Qlik Cloud Reporting Evolution.
But wait, what is it exactly?
Techspert Talks is a free webinar held on a monthly basis, where you can hear directly from Qlik Techsperts on topics that are relevant to Customers and Partners today.
This session Techspert Talks session covered:
- Exploring Cloud Reporting Capabilities
- Using the Excel Add-in
- Glimpsing the future of reporting
Click on this link to see the presentation