Unlock a world of possibilities! Login now and discover the exclusive benefits awaiting you.
Product Innovation
By reading the Product Innovation blog, you will learn about what's new across all of the products in our growing Qlik product portfolio.
Support Updates
The Support Updates blog delivers important and useful Qlik Support information about end-of-product support, new service releases, and general support topics.
Qlik Academic Program
This blog was created for professors and students using Qlik within academia.
Community News
Hear it from your Community Managers! The Community News blog provides updates about the Qlik Community Platform and other news and important announcements.
Qlik Digest
The Qlik Digest is your essential monthly low-down of the need-to-know product updates, events, and resources from Qlik.
Qlik Education
The Qlik Education blog provides information about the latest updates of our courses and programs with the Qlik Education team.
Recent Blog Posts
-
Students at XJTLU China develop apps using Qlik Sense
At XJTLU China, during a summer school boot camp, participants worked on a business scenario to prepare for a business case to develop and challenge their assumptions at different stages. Participants were divided into project teams and discussed those assumptions in virtual rooms. Project teams collected, interpreted, analyzed various forms of internal and external data, and presented their results in the form of digital artifacts (visual dashb... Show MoreAt XJTLU China, during a summer school boot camp, participants worked on a business scenario to prepare for a business case to develop and challenge their assumptions at different stages. Participants were divided into project teams and discussed those assumptions in virtual rooms. Project teams collected, interpreted, analyzed various forms of internal and external data, and presented their results in the form of digital artifacts (visual dashboards of performance indicators) to a Judge Panel using the Technological Authoring Tool Application (Qlik Sense).
To read more about this, visit: https://www.learningmall.cn/en/homepage/ceie/project-based-learning-on-learning-mall-on-data-analytics-using-qlik-sense-(technological-authoring-tool-application).htmlFor access to the Qlik Academic Program's free resources including training and certifications visit: qlik.com/academicprogram
-
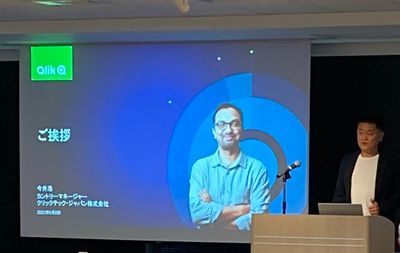
【オンデマンド配信】実務に応用可能!(株)デンソー様講演:第 2 回 Qlik データソン最優秀賞受賞アプリのご紹介
大手自動車部品メーカー、株式会社デンソーのご担当者様より、第 2 回 Qlik データソンにて最優秀賞を受賞したアプリをご紹介いただきます。製品の製造から納入までに関わるあらゆるデータを紐づけて分析できる、All-in-One アプリです。経営、稼働、品質、環境、物流、多様なフォーマットのデータを紐づけるテクニックと、それによる分析の可能性をご紹介いたします。 ※ 参加費無料。パソコン・タブレット・スマートフォンで、どこからでもご視聴いただけます。 今すぐ視聴する 今すぐ視聴する -
-
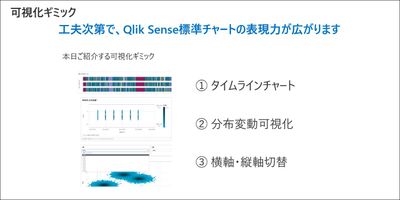
Heatmaps with the updated Grid Chart
How to create a heatmap with the new GridChart What is a heatmap chart? Heatmaps are two-dimensional representations of data that show magnitudes as colors. A color variation - may be based on hue or intensity - gives a clear indication to the reader of how the data measured is distributed or varies over space.The result should be a data piece that doesn't require a lot of explanation. Typically, warm high-contrast colors are used to represent hi... Show MoreHow to create a heatmap with the new GridChart
What is a heatmap chart?
Heatmaps are two-dimensional representations of data that show magnitudes as colors. A color variation - may be based on hue or intensity - gives a clear indication to the reader of how the data measured is distributed or varies over space.
The result should be a data piece that doesn't require a lot of explanation. Typically, warm high-contrast colors are used to represent high-value data points, while cool colors represent low-value data points in heatmaps.
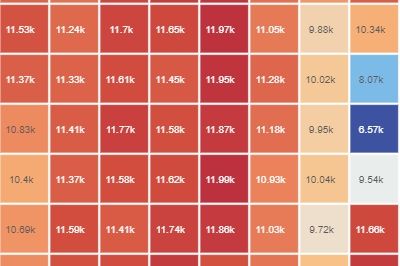
Most common Birth Dates (US)
Qlik Sense Feb 22 (day of the month/month)
The chart above is an excellent use case for a heatmap, it is simple and straight to the point. Births are fairly evenly distributed throughout the year, with a slight bias towards the summer months. The average number of births drops significantly on some days, such as 4th July, 24th-25th December, and January 1st.
There is also a very popular version control product out there that displays a punch-card-like activity chart like the one below that I think is an excellent implementation of a heatmap.
Not my profile
With the February 22 release, the Grid Chart will be your first choice when it comes to heatmaps. In addition to all the features that one expects in a Grid Chart, there is now a shortcut that lets us create a heatmap just like that.
Remember that this chart is especially useful if it is self-explanatory, so try to avoid complex combinations of dimensions. This chart is best suited to time-series-based dimensions.
Enjoy it!
Arturo

-
Meet Emma! Our Newest Member to Qlik Community Team
Dear Members, I am thrilled to introduce Emma Spickerman (@emmaspickerman) who joins Global Customer Marketing as a Community Manager. Emma will be focused on driving engagement across our newly launched Partner area within the Qlik Community. She will also contribute to other advocacy programs including the Partner Ambassador Program. If you are a Qlik Partner who is also participating in our Qlik Community, this is the person you want to kn... Show MoreDear Members,
I am thrilled to introduce Emma Spickerman (@emmaspickerman) who joins Global Customer Marketing as a Community Manager. Emma will be focused on driving engagement across our newly launched Partner area within the Qlik Community. She will also contribute to other advocacy programs including the Partner Ambassador Program.
If you are a Qlik Partner who is also participating in our Qlik Community, this is the person you want to know! (and If you are not participating she will find you! 😄) Emma will be working in collaboration with the Partner Organization to bring news and updates to our (partner) members while making sure no question is left behind.
Emma comes to us with a strong background in Digital Marketing, Consumer Marketing, Public Relations and Sales. She has worked with big brands such as TJX Companies, Inc, Zac Posen and Lexus. Her Bachelor’s degree is from Parsons School of Design in Strategic Design & Management and she also holds a Master’s in Integrated Marketing Communications from Georgetown University.
Based in Massachusetts, Emma loves animals and will be adopting a Cavapoo puppy in the coming months, who she plans to name Beau.

-
Academic Program Student Success Story
From data newbie to Bitmetric business intelligence consultant , all with the Academic Program. -
Qlik Replicate and Qlik Enterprise Manager May 2022 Client Managed Release Highl...
“THE DI IS STRONG IN THIS ONE” – OK so it’s no longer May the 4th but there is another awesome reason to celebrate in May, with the Qlik Data Integration portfolio May 2022 releases. -
May 24, Developer Q&A Series: Customizing Extensions
Are you using Qlik's extension API and trying to figure out how to migrate your custom visualization to Nebula? Join us on May 24th for our Qlik Developer Q&A with Jeffrey Goldberg, Gertrude Westrin, and Nebula.js architect Tobias Åström to share your questions and learn tips and tricks to accelerate your journey to the stars. Feel free to leave your questions in the comments below or ask them in real time during the webinar. This is Support's L... Show MoreAre you using Qlik's extension API and trying to figure out how to migrate your custom visualization to Nebula?
Join us on May 24th for our Qlik Developer Q&A with Jeffrey Goldberg, Gertrude Westrin, and Nebula.js architect Tobias Åström to share your questions and learn tips and tricks to accelerate your journey to the stars.
Feel free to leave your questions in the comments below or ask them in real time during the webinar. This is Support's Live "Office hours", so ask away!
Register Here
See you there!
Qlik Global Support and Qlik Developer Advocates
-
Introducing DAR mashup template
NOTE: To increase resolution or size of the video, select the YouTube logo at the bottom right of the player. You will be brought directly to YouTube where you can increase the resolution and size of the player window. Look for the 'settings' gears icon in the lower right of the player once at YouTube. WhatJust that, a mashup template for dev-hub (aka dead simple drag and drop mashup creator) that ships with a bunch of cool features such as: Dev... Show MoreNOTE: To increase resolution or size of the video, select the YouTube logo at the bottom right of the player. You will be brought directly to YouTube where you can increase the resolution and size of the player window. Look for the 'settings' gears icon in the lower right of the player once at YouTube.
What
Just that, a mashup template for dev-hub (aka dead simple drag and drop mashup creator) that ships with a bunch of cool features such as:
- Dev-hub ready
- Multi Page
- KPI row built in
- Prebuilt CSS color library
- Cards with full screen toggle
- Offcanvas filters pane
- Help modal popup
- Responsive design
- Bootstrap built in
- Custom fonts ready
Why
Because we’ve heard you asking for a more powerful and good-looking template that can constitute a solid framework to create your customized mashups.
Who
Anyone looking for a feature rich mashup template designed for use in the dev-hub.
When
Available today!
Where
You can grab the latest* version here GitHub - fkabinoff/qs-dev-hub-dashboard-template: Dashboard template for Qlik Sense dev hub
*Please notice this is a live project, we will keep updating it frequently. Right now the project documentation (readme.md) is far from what we would like it to be.
-
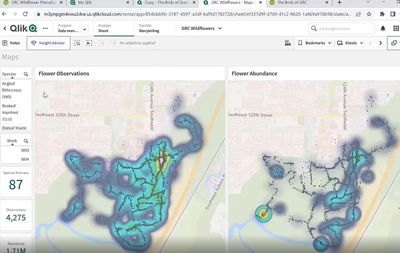
Using Qlik for the Birds and the Bees! A MUST WATCH!
"It automatically updates where they have all been found which is just ridiculous and amazing because to do this with other software is very challenging to say the least. And its more than one click, that's for sure" Educator Danny Najera, Green River College
-
Simplify Enterprise Access Control and Sharing Analytics Content
Qlik Cloud expands access control and flexible app sharing for more granular control over how app content is shared and accessed. -
Qlik GeoAnalytics Server Security Issues: Patches Available
Security issues in Qlik GeoAnalytics Server have been identified and an update containing the fixes is required to prevent system vulnerability. All Qlik GeoAnalytics server versions prior to the service releases listed below are affected. 4 vulnerabilities have been identified, 3 being flagged as high risk due to the possibility of information disclosure impacting the server running GeoAnalytics. Additional details on vulnerabilities are shared ... Show MoreSecurity issues in Qlik GeoAnalytics Server have been identified and an update containing the fixes is required to prevent system vulnerability.
All Qlik GeoAnalytics server versions prior to the service releases listed below are affected. 4 vulnerabilities have been identified, 3 being flagged as high risk due to the possibility of information disclosure impacting the server running GeoAnalytics.
Additional details on vulnerabilities are shared here.
Available Patches:
- May 2022 SR1
- February 2022 SR1
- November 2021 SR4
- May 2021 SR3
- February 2021 SR3
- November 2020 SR3
- September 2020 SR3
- June 2020 SR3
To Download the latest service releases for GeoAnalytics, visit our Qlik Download’s site. You will need to be logged into Qlik Community with your Qlik ID, and filter by Value Added / GeoAnalytics Server / All releases with latest patch.
-
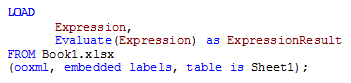
Evaluate() Function
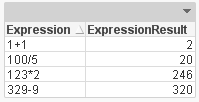
The Evaluate() function is a string function that takes one text string parameter. If the string is a valid QlikView or Qlik Sense expression then the evaluated result of the expression will be returned. If the string is not a valid expression, then Null is returned. The Evaluate() function can only be used in the script and not in a chart expression. Evaluate() will do the math for you in the script and return the result. For example, if yo... Show MoreThe Evaluate() function is a string function that takes one text string parameter. If the string is a valid QlikView or Qlik Sense expression then the evaluated result of the expression will be returned. If the string is not a valid expression, then Null is returned. The Evaluate() function can only be used in the script and not in a chart expression. Evaluate() will do the math for you in the script and return the result. For example, if you are loading a field whose content is expressions like this:
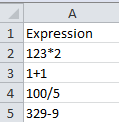
Then you can view that data in two ways. You can either view the actual expression or you can use Evaluate() and view the results.
The Evaluate() function is also useful when you are loading a number from a text file or a text field in a database with more than 14 digits. When that number is loaded into QlikView, it is interpreted as a string since it is too long (more than 14 digits).
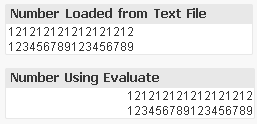
Note that while using Evaluate() returns a number, it is only stored with 14 digit precision. While you may be able to see more than 14 digits, this is just the formatting. The internal mantissa is only 14 digits.
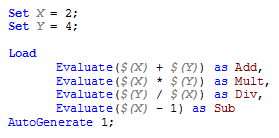
Evaluate() can similarly be used with variables which can be helpful if you have a value that you would like to use multiple times in the script.
So why use a Evaluate()? At first it seemed unnecessary to me because the calculation would still be done without the Evaluate() function but then I realized that that is only the case when the values are numeric and not strings. So Evaluate() is helpful when your expression is in a string format or when the expression is a number with more than 14 digits. It allows a string expression to be evaluated and the result returned. It is like a short-cut to solving the expression. Try it out!
Thanks,
Jennell
-
Exciting updates to Qlik Compose are now available
A new release of Qlik Data Integration is here, with exciting updates to Compose. These updates address our customers’ needs across data lake creation and improved warehouse automation. -
Qlik Digest - June 2022
Welcome to the June Qlik Digest, providing your monthly fix of all things Qlik, including product updates, events and resources.Sharing is caring, so please let other Qlik users at your organization know that they can Subscribe to receive the monthly digest directly to their inbox! -

-
New Qualification Exams Available!
Boost your resume by earning a Qlik Sense Business Analyst or Data Architect certificate and digital badge!
-
Qlik Sense Qualification Exams - 2022 Update
Qlik Education is pleased to announce the Business Analyst and Data Architect Qualification Exams have been updated and are based on the SaaS editions* of Qlik Sense. However, you may also use Qlik Sense on Windows editions.
-
The Academic Program Wraps up 2016!
2016 was an exciting and busy year for the Academic Program which grew by 247 new universities!, The program now expands 64 countries with a total of 709 universities! Some of our new universities include Quinnipiac University in the United States, Cardiff Metropolitan University in the UK, Shailesh J Mehta School Of Management in India, and Universidade do Estado do Para in Brazil. This year the program also released its Data Analytics curricu... Show More 2016 was an exciting and busy year for the Academic Program which grew by 247 new universities!, The program now expands 64 countries with a total of 709 universities! Some of our new universities include Quinnipiac University in the United States, Cardiff Metropolitan University in the UK, Shailesh J Mehta School Of Management in India, and Universidade do Estado do Para in Brazil.
This year the program also released its Data Analytics curriculum for professors and began offering FREE training though the Qlik Continuous Classroom to professors and students who joined the program!
The first course offered in the curriculum is called Data Visualization. This course features lecture notes, course materials, and student exercises that professors can use to help them teach the history and theory behind Data Visualization. The course is ad-hoc so professors can use some or all of the materials depending on their needs. It also has pre-requisites from the Qlik Continuous Classroom so the materials blend seamlessly with our free training offering.
Students and professors who are accepted into the program are also enrolled in a full-year subscription to free Qlik Sense and QlikView training through on OnDemand learning platform, the Qlik Continuous Classroom. The QCC offers hundreds of videos, take away documents, quizzes and live instructor access! Its an ideal way to learn Qlik at your own pace. To access free training, apply to the program by visiting http://www.qlik.com/us/company/academic-program.
-
Check out Improved Navigation, New Connectors, Blocks, and Templates in the Late...
A new release of Qlik Application Automation is here, with improved navigation, the ability to zoom in and out of automations, and several new connectors, blocks, and templates. Let’s first dive into the new connectors and blocks. Then, look for more information on the individual links for “Getting Started” articles.