Unlock a world of possibilities! Login now and discover the exclusive benefits awaiting you.
Announcements
Introducing Qlik Answers: A plug-and-play, Generative AI powered RAG solution.
READ ALL ABOUT IT!
- Qlik Community
- :
- Discover
- :
- Blogs
- :
- Product
- :
- Design
- :
- Bike.qlik.com - The beauty of Qlik's Open Source w...
Employee
2018-04-27
10:04 AM
- Subscribe to RSS Feed
- Mark as New
- Mark as Read
- Bookmark
- Subscribe
- Printer Friendly Page
- Report Inappropriate Content

Hopefully you all attended Qonnections 2018 and saw Jimmie on the bike  !!!
!!!
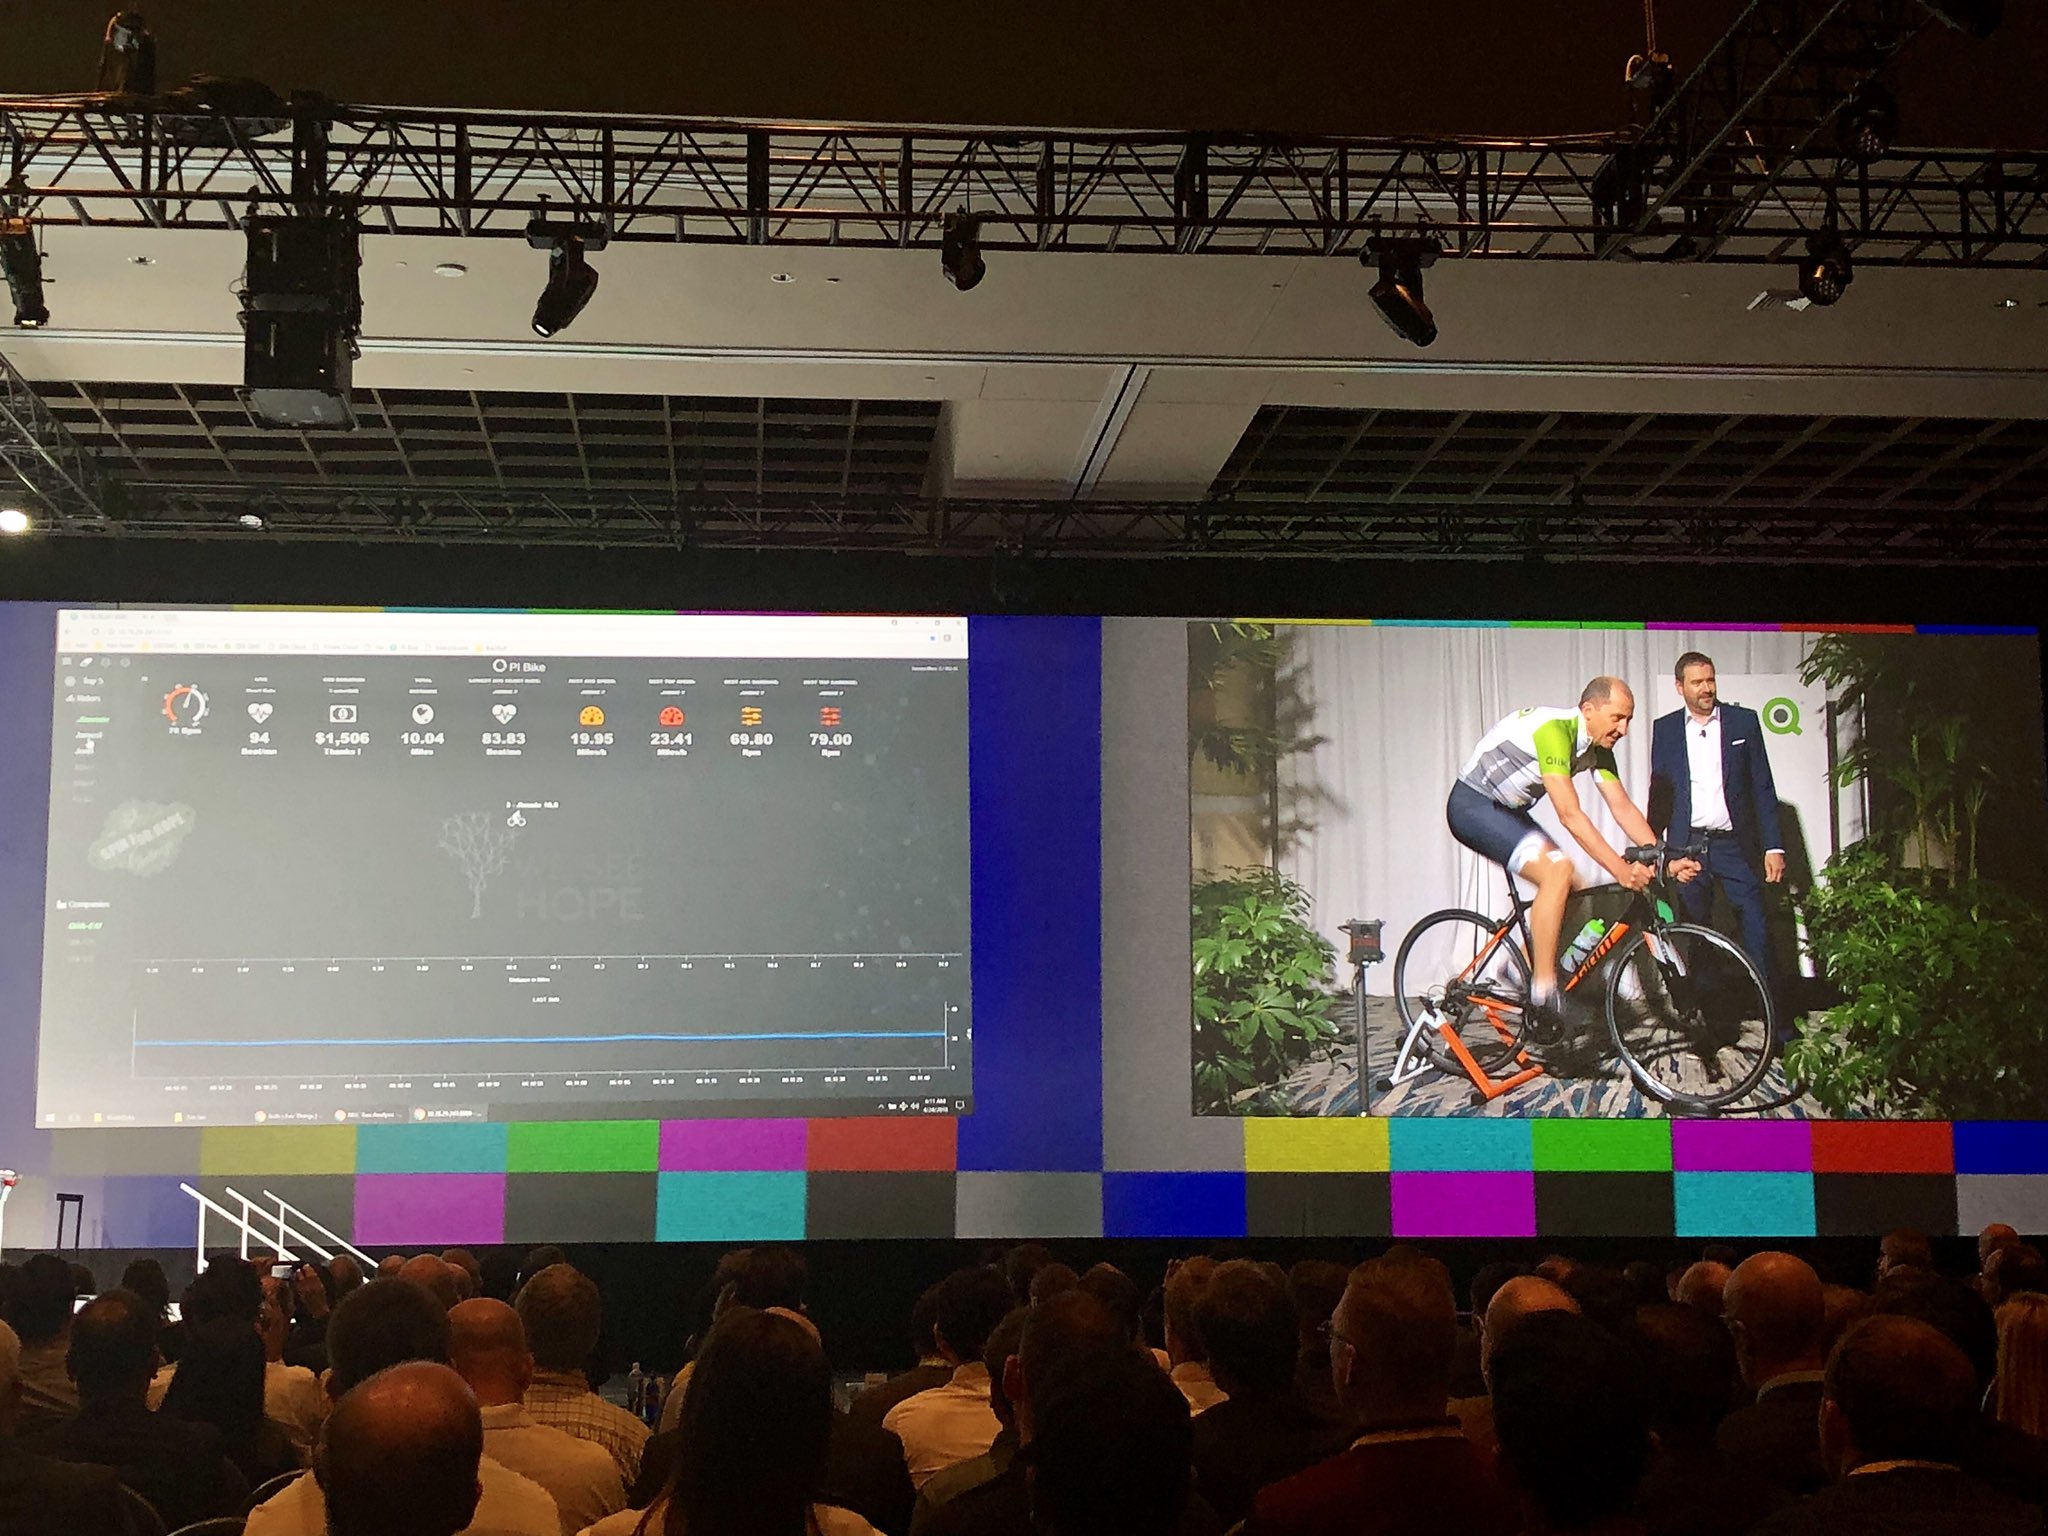
Bike.qlik.com is the latest mashup build entirely with Qlik's open source libraries, Qlik Core, Enigma.js, Picasso.js, Leonardo UI and the Demo Team's Qdt-components.
Here is briefly how we did it
- Sensors are sending data wireless to the Raspberry Pi
- Node.js reads and writes csv
- Qlik Core in Raspberry Pi is reading csv with a reload script and saves the data
- Enigma.js connects and gets the data from Qlik Core then, Picasso.js is displaying that data in a graphical format
- Node.js is uploading the qvds on Bike.qlik.com
- Bike.qlik.com is a Docker that runs 2 containers in an AWS EC2 instance. One for the Qlik Core / Engine and another for an apache server
- The htdocs and the Apps for the Qlik Core, are mounted outside of the 2 containers so there is no need to reload containers or recreate the Docker images, once the html code is changed or the qvf
- Once uploaded, a Node.js restful api endpoint is reloading the session app, reads the new data from the just uploaded qvds and saves the qvf with the new data
- React.js with Qdt-components is connecting to Qlik Core on the server and is getting the data
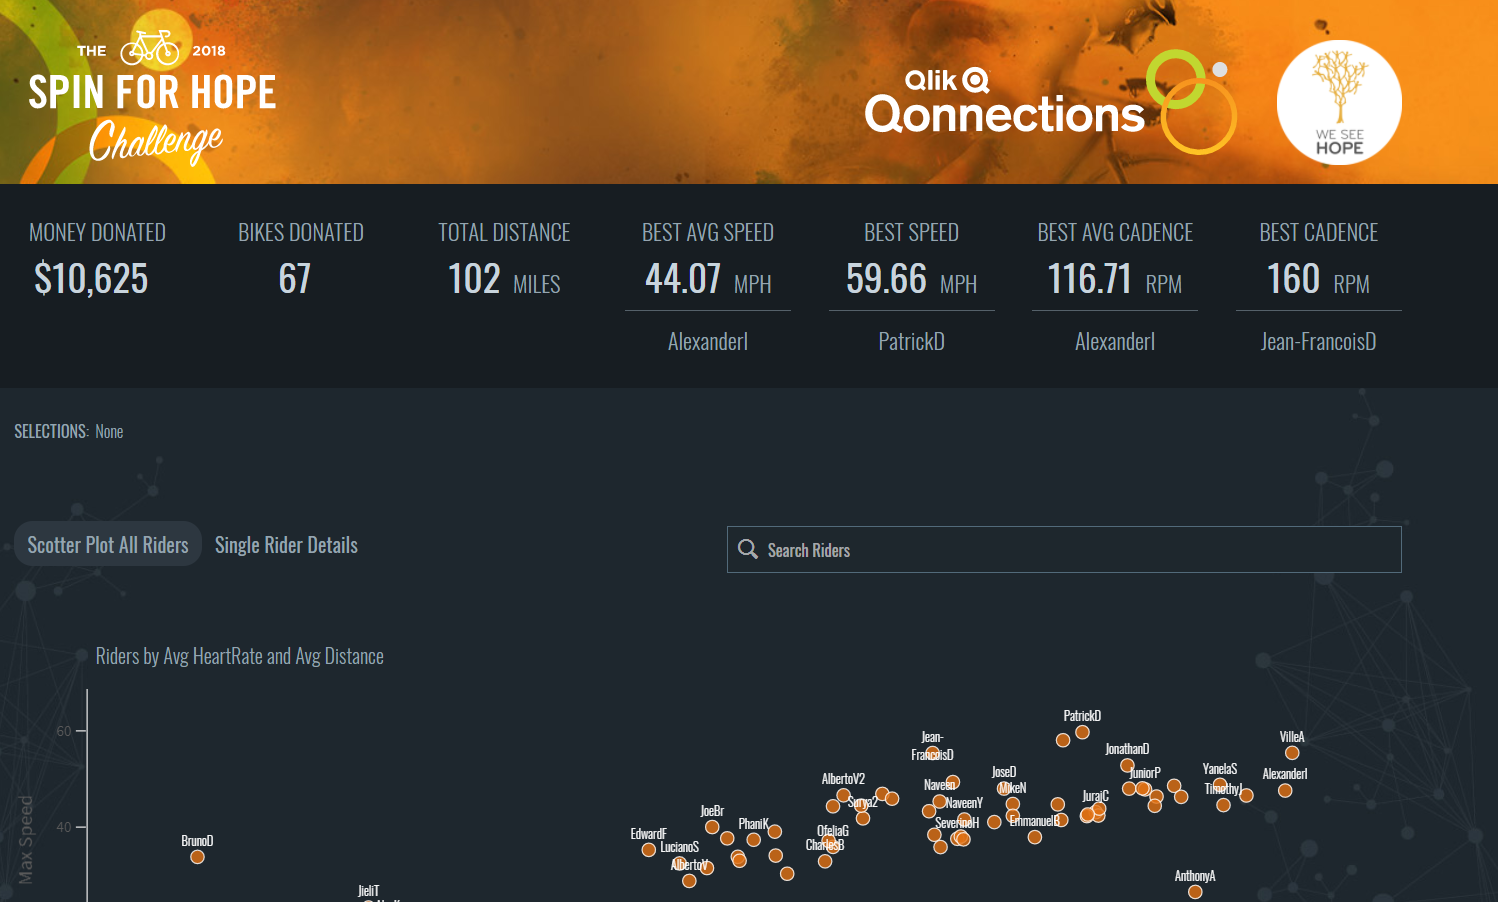
- Qdt-components is rendering 11 KPI components and one search component (Leonardo UI) on the Rider field
- Picasso.js is used to read the data and display a scatter plot and a line chart with tooltip and multiple selections
Expect more examples in the coming future with these combinations of our Open Source Software!!!!!
Yianni
8 Comments
You must be a registered user to add a comment. If you've already registered, sign in. Otherwise, register and sign in.