Unlock a world of possibilities! Login now and discover the exclusive benefits awaiting you.
Explore Qlik Gallery
Qlik Gallery is meant to encourage Qlikkies everywhere to share their progress – from a first Qlik app – to a favorite Qlik app – and everything in-between.
- Qlik Community
- :
- Discover
- :
- Qlik Gallery
- :
- Qlik Gallery
- :
- Explore Qlik Gallery - Page 3
- Mark all as New
- Mark all as Read
- Float this item to the top
- Subscribe
- Bookmark
- Subscribe to RSS Feed
Explore Qlik Gallery - Page 3

The purpose of the sales dashboard is to provide a comprehensive overview of key sales metrics, enabling decision-makers to monitor performance, identify trends, and take strategic actions. The app consolidates data related to sales revenue, customer insights, and performance indicators to ensure informed decision-making. Value of the Dashboard: Real-time Decision-Making: Access to up-to-date sales data allows for quick adjustments in strategy. Improved Sales Performance: By tracking key metrics, teams can optimize their efforts and improve overall sales productivity. Customer Retention and Growth: The dashboard provides insights into customer trends, helping improve retention and grow customer base. Strategic Planning: Helps in forecasting and long-term business planning through detailed revenue and performance insights.

WhatsApp for Qlik Answers gives you the power to converse with Qlik Answers assistants in a completely open and conversational way through WhatsApp.

This application shows the evolution of cases over the years, mainly information from Brazil.

WHAT IF: you would bet €10 on your favorite sports team for every game?⚽ Would you end up with a profit by the end of the season? Let's find out! What IF analysis in combination with Football Betting Data, visualized using the powerful Layout Container.

Visually show and explain the main join that can be used in script
Step 1: Read Instructions
To share your app you will need to download and edit a PowerPoint template, upload images, create and submit a community post
- Download PowerPoint Template (button #2)
- Export slide to JPEG format (for instructions see button #3)
- To submit your app, click button #4 to open the new post page
- Then click SAVE and you've shared your first app to the Qlik Gallery!
Step 2: Download Template
Step 3: Export Slide to JPG
Please follow these instructions to export your slide to JPEG format:
PowerPoint > File > Export > Change File Type > Select "JPEG File Interchange Format" > Save As > Use file name "COMPANY - app name.jpeg" > SAVE.
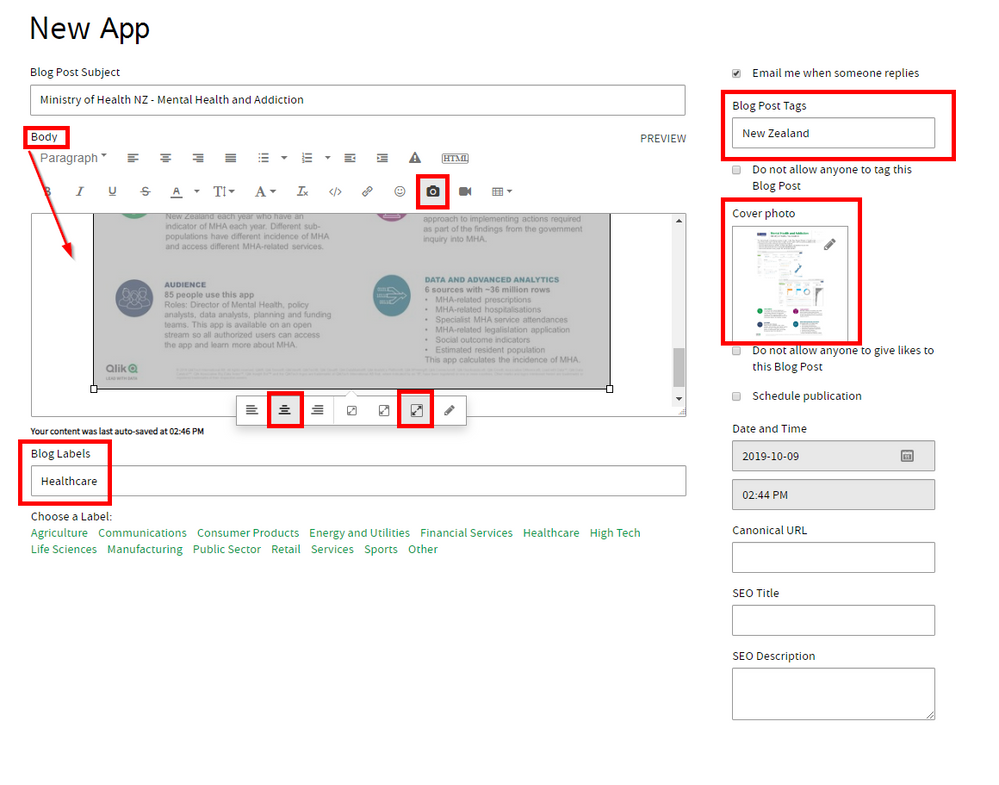
Step 4: Submit your App!
To keep the Gallery well organized please do the following:
- On the new post page, add a title as follows: "Company - App Name",
- Add your JPEG file to the COVER PHOTO. Also insert into the BODY FIELD, using the Large Image Size.
- Add label(s) to indicate your industry
- and tags for country location (you may add other tags as well)
Remember to add your JPEG file to the COVER PHOTO. Also insert into the BODY FIELD, using the Large Image Size.