Unlock a world of possibilities! Login now and discover the exclusive benefits awaiting you.
Recent Documents
-
How To /Missing Manual (25 articles)
How To / Missing Manual QlikView functions explainedHeader 1Header 2123456789101112131415161718192... Show More
How To / Missing Manual
QlikView functions explainedDid You like it?

-
Do you Qualify?- How to use QUALIFY statement
What it is used for?The Qualify statement is used for switching on the qualification of field names, i.e. field names will get the table name as a pre... Show MoreWhat it is used for?
The Qualify statement is used for switching on the qualification of field names, i.e. field names will get the table name as a prefix.’

In situation where we have two (or more) Tables with the same field names:
Product Payment 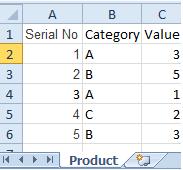
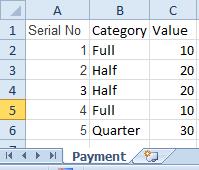
The Qualify statement will assign name of the Table to fields:
- To use the script below the Excel file must be saved in the same folder that your qvd file
Otherwise you will need to make changes the this path - [Qualify.xlsx]
QUALIFY *;
Product:
LOAD [Serial No],
Category,
Value
FROM
Qualify.xlsx
(ooxml, embedded labels, table is Product);
QUALIFY *;
Payment:
LOAD [Serial No],
Category,
Value
FROM
Qualify.xlsx
(ooxml, embedded labels, table is Payment);The Outcome:
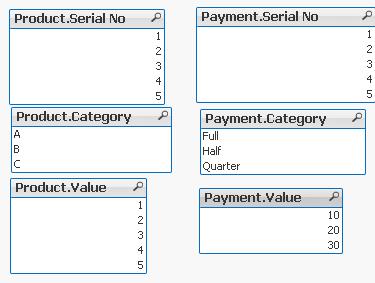
Table Viewer:
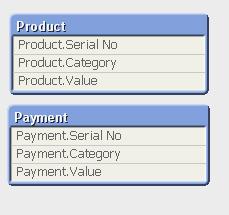
Read only if you need to know more....
If we have not used ‘QUALIFY’ statement in situation as above Qlikview would map both of the Tables with outcome like below:
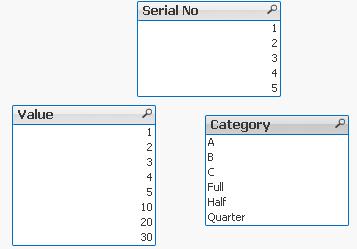
The end result -merge of those two Tables is correct only for the “Serial No” fields
The “Value” and “Category” fields although merged is none of use to us.
To fix this we can only Qualify fields that we do not want to associated:
QUALIFY Category,
Value;
Product:
LOAD [Serial No],
Category,
Value
FROM
Qualify.xlsx
(ooxml, embedded labels, table is Product);
QUALIFY Category,
Value;
Payment:
LOAD [Serial No],
Category,
Value
FROM
Qualify.xlsx
(ooxml, embedded labels, table is Payment);
or by using UNQUALIFY statement:
(which works as opposite to QUALIFY)
QUALIFY *;
UNQUALIFY [Serial No];
Product:
LOAD [Serial No],
Category,
Value
FROM
Qualify.xlsx
(ooxml, embedded labels, table is Product);
QUALIFY *;
UNQUALIFY [Serial No];
Payment:
LOAD [Serial No],
Category,
Value
FROM
Qualify.xlsx
(ooxml, embedded labels, table is Payment);In second example the ‘QUALIFY *’ part will add Table name to all fields and the UNQUALIFY statement will remove those names only from specified fields(this method is very useful if we got large numbers of fields)
Outcome is as below:
Fields:

Table Viewer:

Feeling Qlikngry?
-
QlikView App - Generic Data Profiler
Often when building QlikView applications, or picking up applications which have been built by someone else I want to have a quick and easy way of vie... Show MoreOften when building QlikView applications, or picking up applications which have been built by someone else I want to have a quick and easy way of viewing the data that is in that application. To enable me to do this I have put together a page of objects that lists all tables and fields in the data model and then gives outline information about any selected field. These objects can be copied and pasted into any QlikView application to view the data model of that document.
I have documented how this document works and the reasons why you might use it in a blog post here:
https://www.quickintelligence.co.uk/qlikview-data-profiler/
Please see the blog post for further details on using this document.
There is now a Qlik Sense version of this app, which you can find on Qlik Community here:
Qlik Sense App: Generic Data Profiler
I hope that you find it useful. You will find other applications that I have uploaded under my profile on QlikCommunity, or on our Downloads Page.
Steve
https://www.quickintelligence.co.uk/blog/
PLEASE NOTE: The 'With Mask' version of the file includes an experimental tab that may or may not work well on large data sets. Please see comment below for details. If you are not sure which to download go for DataProfiler.qvw. Thanks!
-
How to use - MaxString & MinString
Bullet points:MaxString and MinString belongs to Qlikview String Aggregation function.They are equivalent to MAX and MIN for integersThey return the h... Show MoreBullet points:
- MaxString and MinString belongs to Qlikview String Aggregation function.
- They are equivalent to MAX and MIN for integers
- They return the highest and lowest string value
What actually a value of a string?
This is the value described by ANSI character standard where 0 ( NULL) is equal to 0 and ÿ to 255.
(For full ANSI character set please attached dosument)
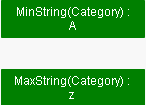
Taking only the standard English alphabet (A-z) ‘A’ will be the MIN and ‘z’ will be the MAX.
Remember:
In ANSI standard A < a and Z < z
(A=65,Z=90,a=97,z=122)
Language specific characters will be not recognized in the place where they are in your alphabet but they will be 'pushed' to the end
(see ANSI table)
MinString and MaxString works on dimensions (columns) only so you cannot use is to evaluate single character or strings .
(MaxString(‘a’,’z’…) is not supported
Examples:
1) MIN & MAX (textbox)
Data Expression Results 
MinString(Category)
MaxString(Category)
2) MIN and MAX of String per group (Straight table)
Data Expression Result 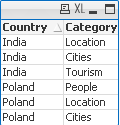
MinString(Category)
MaxString(Category)

3) With condition:
Return Max and Min string based on another column
We are looking for MIN and MAX string value from column Category where Country='Poland'
Data Expression Solution Result 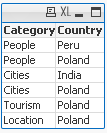
MinString( if(Country='Poland', Category, null()) )
MaxString( if(Country='Poland', Category, null()) )


4) With LEFT/RIGHT
When used with LEFT the result will be the same as without as the value will be still based on first characters.
Data Expression Solution Result 
=MinString( Right(Country,1))
=MaxString( Right(Country,1))


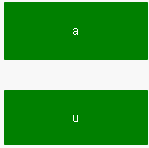
5) With MID
Data Expression Solution Result 
=MinString( Mid(Country,2,2))
=MaxString( Mid(Country,2,2))


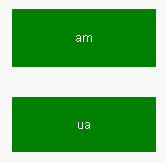
6) With Substring
When our data are little scrambled -TextBetween will return string between '.' and end of the row.
Data Expression Result 
=MinString(TextBetween(Country,'.','',1))
=MaxString(TextBetween(Country,'.','',1))

7) In set analysis
When Criteria of Sales is 2 return Country with highest and lowest string Value
Data Expression Result 
=MinString({<Sales={2}>} Country)
=MaxString({<Sales={2}>} Country)
😎 With Aggr()
For each Country return lowest and highest Category string value.
Data Expression Result 
=Aggr(Minstring(Category),Country)
=Aggr(Maxstring(Category),Country)

If know about other ways of using these functions please let me know.
-
QlikView App - Structure File Viewer
QlikView creates a number of log files and XML files. From project folders through to reload logs and QMC schedules. Perhaps unsurprisingly the best... Show MoreQlikView creates a number of log files and XML files. From project folders through to reload logs and QMC schedules. Perhaps unsurprisingly the best tool to consume these files is QlikView itself.
This application loads the structure files that QlikView allows you to extract based on the data model of the currently open app. It then gives a few simple ways of viewing that information.
There is an accompanying blog post describing the ways that you can use the structure files created by QlikView, and apps such as this to quickly get a handle on a new data source and work out a plan of attack to analyse it.
This can be found here:
http://www.quickintelligence.co.uk/qlikview-data-structures/
There is also a list of the other apps that I have made available on Qlik Community on the site, here:
http://www.quickintelligence.co.uk/qlikview-examples/
If you have any questions about the application, or suggestions on how it could be improved, please leave these below or in the comments on the blog post itself.
Steve
-
(VBScript) - Step by Step - Suppress Zero Values
Step by Step Guide how to Show/Hide Zero Values using buttons.Still feeling hungry?How to use - Only()Do you Qualify?- How to use QUALIFY statementHow... Show MoreStep by Step Guide how to Show/Hide Zero Values using buttons.
Still feeling hungry?
Do you Qualify?- How to use QUALIFY statement
Missing Manual - GetFieldSelections() + Bonus Example
MaxString & MinString - How to + examples
The second dimension... or how to use secondarydimensionality()
Missing Manual - Below() and Above()
-
QlikView App: Create list boxes that work in an OR mode
In October 2013 the QlikView Masters Summit came to London. During the event there was a Quiz the Masters session and the question was asked was ther... Show MoreIn October 2013 the QlikView Masters Summit came to London. During the event there was a Quiz the Masters session and the question was asked was there a way to create ListBoxes that work in a OR fashion rather than an AND.
At the time no one could think of a simple way of achieving this - but I thought I would try a few things out. This document is some of my workings.
The first attempt was based on creating a linked table with all values in for each field that was to be included in the and. These would be split into separate list boxes with Expressions in the List Box. Unfortunately although those selections should not be mutually exclusive - from a data model perspective - they are.
The second attempt kind of worked - but looked pretty bad. The values from each of the fields were placed in a single field with a prefix showing which field they had come from. Selections could then be made from values from each of the source fields and the resultant selections did give an AND of the values. It was a kind of solution.
The third attempt works and the list boxes look exactly like the natural list boxes. This is achieved by loading every value for each field that needs to be used in the OR into a separate table stored as a Data Island. By changing any expressions to use Set Analysis and a P modifier looking at the data islands values can be found for any rows where a selection is made in any of the fields. This ticks the boxes (I believe) for answering the question.
However.... I would really not recommend the third approach as it requires duplication of much of the data model in memory and could perform very badly. Also, if a user was to pick one of the data island fields when they thought they were picking an actual dimension things could go very bad with a Cartesian product occurring. Perhaps a Hide Prefix on those fields would make it less risky though.
So, at the end of the day - this is very much open for discussion and I would welcome any further suggestions on how this could be achieved.
Happy Qliking
Steve
http://www.quickintelligence.co.uk/qlikview-blog/
[Note: there is a function called AND MODE in QlikView and this works in simple cases. It wasn't deemed appropriate for this solution though]


