Unlock a world of possibilities! Login now and discover the exclusive benefits awaiting you.
- Qlik Community
- :
- Discover
- :
- Programs
- :
- Education
- :
- Qlik Education Discussions
- :
- Aligning objects to charts!
- Subscribe to RSS Feed
- Mark Topic as New
- Mark Topic as Read
- Float this Topic for Current User
- Bookmark
- Subscribe
- Mute
- Printer Friendly Page
- Mark as New
- Bookmark
- Subscribe
- Mute
- Subscribe to RSS Feed
- Permalink
- Report Inappropriate Content
Aligning objects to charts!
Hi,
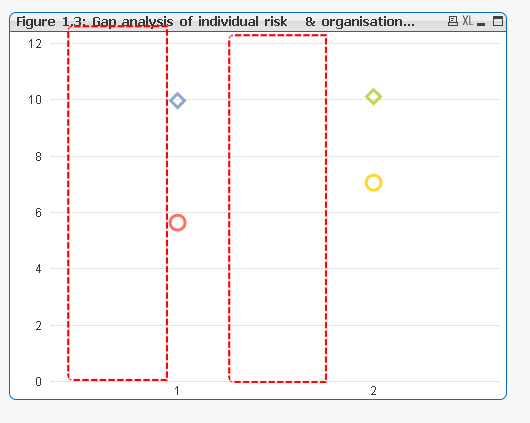
I am having some trouble with aligning objects to charts, I have not been able to discover a way of getting this to work! Below is an example of what I am trying to achieve, basically, i need the red box to appear only if the gap between the 2 points is greater than a certain number.

I have this working fine when all of the dimensions of the chart are displayed as you can see! The issue arises when the dimensions change!
I need some way of either attaching the objects to the chart labels or having a variable that I can use to delete of the objects if there are 1, 2 or 3 dimensions being shown in the chart!
I would really appreciate any comments regarding the issue!
Thanks
Peter
- Tags:
- qlikview
- Mark as New
- Bookmark
- Subscribe
- Mute
- Subscribe to RSS Feed
- Permalink
- Report Inappropriate Content
I assume that you put objects over eachother in some kind, right? If yes this will be difficult to exclude all contingencies. Mostly led the approach to overlapp two nearly identical charts and then adjust the various options (per hiding) to best results.
But maybe it's easier to try to highlight your data-points itself with attribut-expressions about color or similar.
- Marcus
- Mark as New
- Bookmark
- Subscribe
- Mute
- Subscribe to RSS Feed
- Permalink
- Report Inappropriate Content
maybe you can hide the object based on selection
In the layout tab of this object under show Conditional
GetSelectedCount(Dimension)-1
- Mark as New
- Bookmark
- Subscribe
- Mute
- Subscribe to RSS Feed
- Permalink
- Report Inappropriate Content
Hi Marcus, thanks for the speedy response!
Thanks, I will try it out
Peter