Unlock a world of possibilities! Login now and discover the exclusive benefits awaiting you.
- Qlik Community
- :
- Discover
- :
- Programs
- :
- Learning
- :
- Qlik Learning Discussions
- :
- Re: Data upload on Qlikview
- Subscribe to RSS Feed
- Mark Topic as New
- Mark Topic as Read
- Float this Topic for Current User
- Bookmark
- Subscribe
- Mute
- Printer Friendly Page
- Mark as New
- Bookmark
- Subscribe
- Mute
- Subscribe to RSS Feed
- Permalink
- Report Inappropriate Content
Data upload on Qlikview
Hi,
Please find the attacched sample file of my data. The time frame is in Month, Quarters, H1 and Year in a single row. Which can't be uploaded on qlikview as such. I want list box of Years, Quarter, Half-year and Year seperately on qlikview. Please, provide me with the upload script.
Thanks and regards,
Akshay
Accepted Solutions
- Mark as New
- Bookmark
- Subscribe
- Mute
- Subscribe to RSS Feed
- Permalink
- Report Inappropriate Content
Hi
Try this
Tmp:
CrossTable(Period, Data, 7)
LOAD *
FROM
[Sample File 10th_Feb_2015.xlsx]
(ooxml, embedded labels, table is Sheet1);
NoConcatenate
Test:
LOAD*,
Year(Date) As Year,
Month(Date) As Month,
If(Len('Q'&Ceil(Month(Date)/3))>1,'Q'& Ceil(Month(Date)/3)) As Quarter,
If(Len('H'&Ceil(Month(Date)/6))>1,'H'& Ceil(Month(Date)/6)) AS HalfYear;
Load*,
Date(MakeDate(TmpYear,Month(TmpMonth)),'YYYY-MM') as Date;
LOAD *,
20& Right(Period,2) As TmpYear,
Date#(If(Not Period like 'Q*' And Not Period like 'H*' And Not Period like 'FY*' ,Left(Period,3)),'MMM') As TmpMonth
Resident Tmp;
Drop Table Tmp;
Drop Fields TmpMonth,TmpYear;
- Mark as New
- Bookmark
- Subscribe
- Mute
- Subscribe to RSS Feed
- Permalink
- Report Inappropriate Content
Use the crosstable function:
CrossTable(Period, Value, 7)
LOAD * FROM [myexcelfile.xlsx]
(ooxml, embedded labels, table is Sheet1);
talk is cheap, supply exceeds demand
- Mark as New
- Bookmark
- Subscribe
- Mute
- Subscribe to RSS Feed
- Permalink
- Report Inappropriate Content
Hi Gysbert with your solution I'm getting error that
"Field name must be unique"
Any idea why?
- Mark as New
- Bookmark
- Subscribe
- Mute
- Subscribe to RSS Feed
- Permalink
- Report Inappropriate Content
Hello Gysbert,
I tried but following is the result.
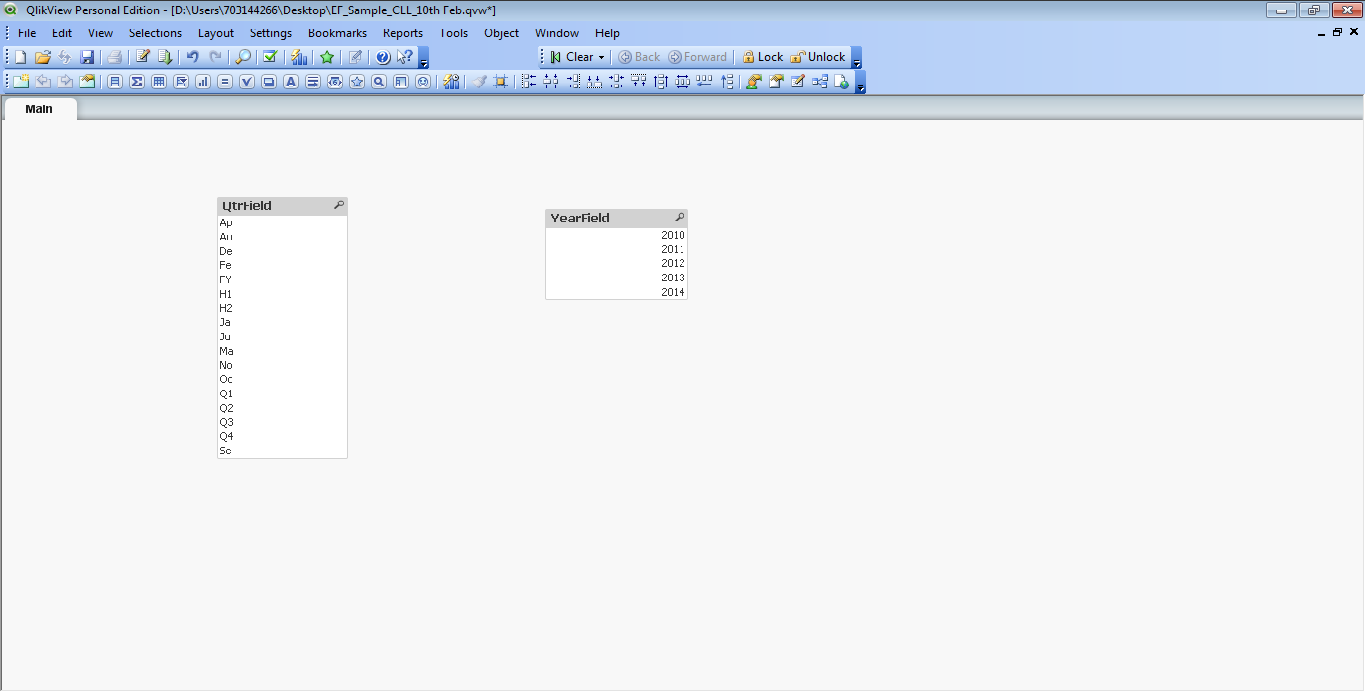
Where, i want different list box for Each time frame.
- Mark as New
- Bookmark
- Subscribe
- Mute
- Subscribe to RSS Feed
- Permalink
- Report Inappropriate Content
Hi
Try this
Tmp:
CrossTable(Period, Data, 7)
LOAD *
FROM
[Sample File 10th_Feb_2015.xlsx]
(ooxml, embedded labels, table is Sheet1);
NoConcatenate
Test:
LOAD*,
Year(Date) As Year,
Month(Date) As Month,
If(Len('Q'&Ceil(Month(Date)/3))>1,'Q'& Ceil(Month(Date)/3)) As Quarter,
If(Len('H'&Ceil(Month(Date)/6))>1,'H'& Ceil(Month(Date)/6)) AS HalfYear;
Load*,
Date(MakeDate(TmpYear,Month(TmpMonth)),'YYYY-MM') as Date;
LOAD *,
20& Right(Period,2) As TmpYear,
Date#(If(Not Period like 'Q*' And Not Period like 'H*' And Not Period like 'FY*' ,Left(Period,3)),'MMM') As TmpMonth
Resident Tmp;
Drop Table Tmp;
Drop Fields TmpMonth,TmpYear;
- Mark as New
- Bookmark
- Subscribe
- Mute
- Subscribe to RSS Feed
- Permalink
- Report Inappropriate Content
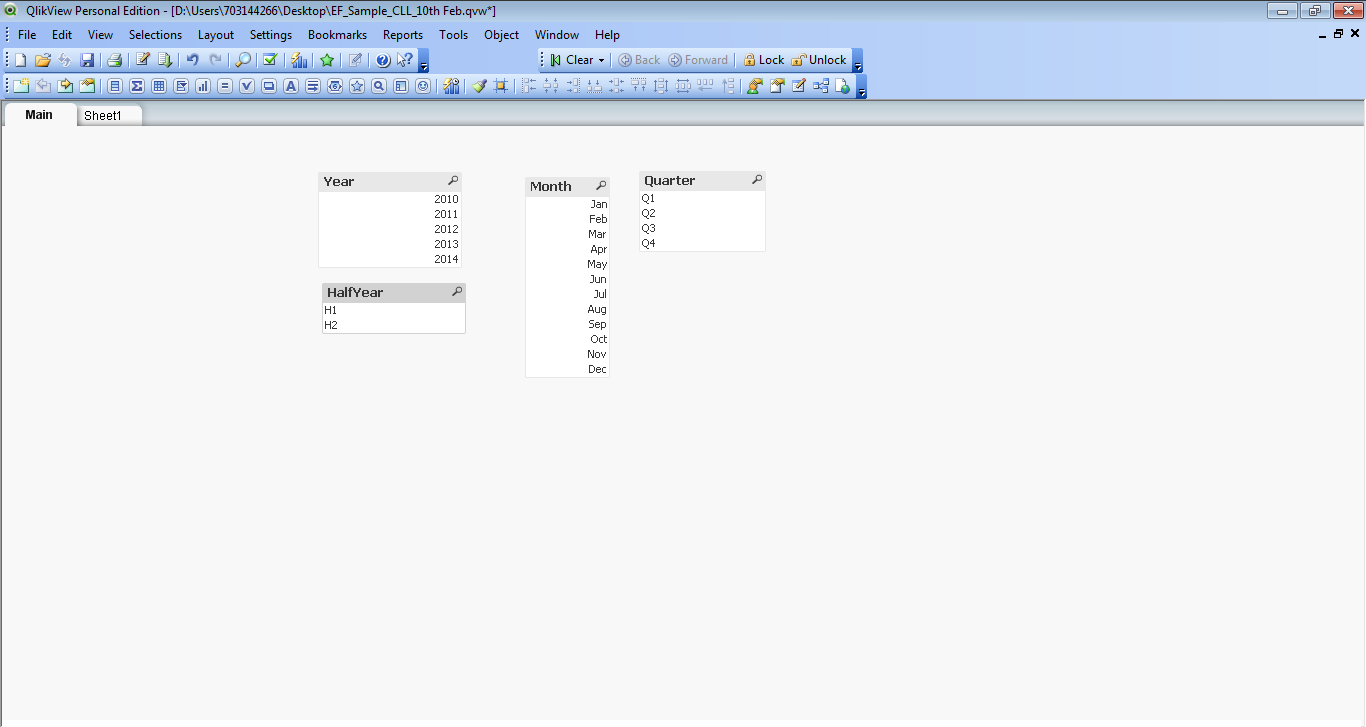
Hello Nils,
Thanks for the help, it is absoultely correct answer for my query. Following is the result i got. I am new to qlikview use. Can u suggest how can i learn the developer part with online help.
Thank u so much with best regards
Akshay
- Mark as New
- Bookmark
- Subscribe
- Mute
- Subscribe to RSS Feed
- Permalink
- Report Inappropriate Content
Hi
No problem. You can always start here.
To get started with QlikView I recommend attending the following resources:
Free Training. Visit here QlikView Free Training - Business Intelligence (BI) Reporting Software Solutions | Qlik
Free Videos. Visit here New to QlikView Videos
Attend our training. Visit here to learn more about our instructor led training QlikView Training - Business Intelligence (BI) Reporting Software Solutions | Qlik
- Mark as New
- Bookmark
- Subscribe
- Mute
- Subscribe to RSS Feed
- Permalink
- Report Inappropriate Content
Thanks Nils.
Its a great Help. In my data sheet the data are there in Month, Quarter, Halfyear and FY. I want to calcualte "year to date(YTD)" and "YTD pvs Year". Please help me in this.
Regards,
Akshay
- Mark as New
- Bookmark
- Subscribe
- Mute
- Subscribe to RSS Feed
- Permalink
- Report Inappropriate Content
Hi
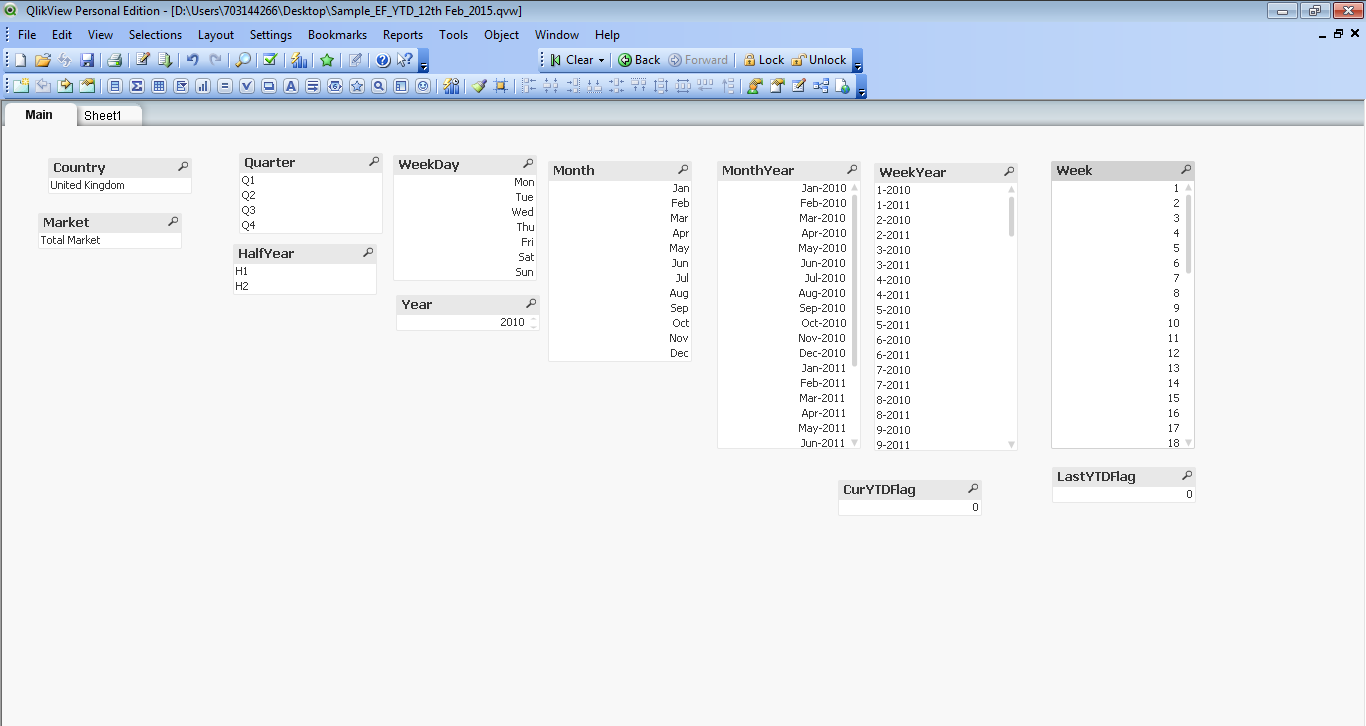
When working with dates it is usually best to move these into a calendar table. In your case the script would look something like this. Using autogenerate functions to generate dates even for days without data. In you example you do not have any days so all transactions will be considered to have taken place on the first of every month. The YTD and LYTD is based on "Today" and generate either a 1 or a 0 based on the period so when used in a calculations you can use these flags to calculate current year or last year. Now if you don't have data for this or lasr year then the script will have to be changed a bit. You can also use SET Analysis for YTD and LYTD functions.
Tmp:
CrossTable(Period, Data, 7)
LOAD *
FROM
(ooxml, embedded labels, table is Sheet1);
NoConcatenate
Test:
Load*,
Date(MakeDate(TmpYear,Month(TmpMonth)),'YYYY-MM-DD') as Date;
LOAD *,
20& Right(Period,2) As TmpYear,
Date#(If(Not Period like 'Q*' And Not Period like 'H*' And Not Period like 'FY*' ,Left(Period,3)),'MMM') As TmpMonth
Resident Tmp;
Drop Table Tmp;
Drop Fields TmpMonth,TmpYear;
///////////// MinMax Table ////////////
MinMax:
LOAD
Min(Date) As MinDate,
Max(Date) As MaxDate
Resident Test;
LET vMinDate = Num(Peek('MinDate',0,'MinMax'));
LET vMaxDate = Num(Peek('MaxDate',0,'MinMax'));
///////////// Temp Calendar ////////////
TempCal:
LOAD
Date($(vMinDate)+ RowNo() -1) As TempDate
AutoGenerate
$(vMaxDate)-$(vMinDate) +1;
DROP Table MinMax;
//*************** Master Calendar ***************
MasterCalendar:
LOAD
TempDate AS Date,
Week(TempDate) AS Week,
Year(TempDate) AS Year,
Month(TempDate) AS Month,
Day(TempDate) AS Day,
Weekday(TempDate) AS WeekDay,
If(Len('Q'&Ceil(Month(TempDate)/3))>1,'Q'& Ceil(Month(TempDate)/3)) As Quarter,
If(Len('H'&Ceil(Month(TempDate)/6))>1,'H'& Ceil(Month(TempDate)/6)) AS HalfYear,
Date(monthstart(TempDate), 'MMM-YYYY') AS MonthYear,
Week(TempDate)&'-'&Year(TempDate) AS WeekYear,
inyeartodate(TempDate, Today(), 0) * -1 AS CurYTDFlag,
inyeartodate(TempDate, Today(), -1) * -1 AS LastYTDFlag
RESIDENT TempCal
ORDER BY TempDate ASC;
DROP TABLE TempCal;
- Mark as New
- Bookmark
- Subscribe
- Mute
- Subscribe to RSS Feed
- Permalink
- Report Inappropriate Content
Hello Morris,
I applied ur script, and following result i got. Can you further help me, how to draw a YTD, or QoQ vs PY or YTD vs PY graphs using these list box.