Unlock a world of possibilities! Login now and discover the exclusive benefits awaiting you.
- Qlik Community
- :
- Discover
- :
- Programs
- :
- Education
- :
- Qlik Education Discussions
- :
- Re: Pie chart names
- Subscribe to RSS Feed
- Mark Topic as New
- Mark Topic as Read
- Float this Topic for Current User
- Bookmark
- Subscribe
- Mute
- Printer Friendly Page
- Mark as New
- Bookmark
- Subscribe
- Mute
- Subscribe to RSS Feed
- Permalink
- Report Inappropriate Content
Pie chart names
Hi,
I need to put names on my pie chart.
For example I have revenue category named contracts with 55%. So I need on my pie name on a slice: Contracts 55%.
No legend.
I tried to do the following:
created expression which does:
if (count (distinct [Revenue Category])=1,[Revenue Category], 'Others') with Data value on points.
But it did not help.
Please advise.
Thanks,
Accepted Solutions
- Mark as New
- Bookmark
- Subscribe
- Mute
- Subscribe to RSS Feed
- Permalink
- Report Inappropriate Content
There is a very good example in the Developer Cookbook.
I am attaching the exercise file for you to see the expression.
You can modify it accordingly and use it on your pie label.
I hope this helps 🙂
Agis
- Mark as New
- Bookmark
- Subscribe
- Mute
- Subscribe to RSS Feed
- Permalink
- Report Inappropriate Content
PFA
- Mark as New
- Bookmark
- Subscribe
- Mute
- Subscribe to RSS Feed
- Permalink
- Report Inappropriate Content
Hello Inna
Could you please let us know if the answers helped or is it something else you are looking for?
Regards
Agis
- Mark as New
- Bookmark
- Subscribe
- Mute
- Subscribe to RSS Feed
- Permalink
- Report Inappropriate Content
Hi,
answer of Massimo seems to be helpful, but I confess, complicated for understanding it myself.
Would like to get explanation for his model.
Thanks,
- Mark as New
- Bookmark
- Subscribe
- Mute
- Subscribe to RSS Feed
- Permalink
- Report Inappropriate Content
Hi Inna,
You can add text(s) in the presentation Tab of the Chart Properties(Text in Chart). The text can be Static Text or Expression.
Regs
Ram
- Mark as New
- Bookmark
- Subscribe
- Mute
- Subscribe to RSS Feed
- Permalink
- Report Inappropriate Content
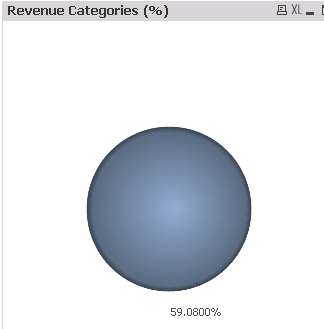
Hi Massimo,
I tried it on my model with the following formula attached in notepad.
But I got a pie without a name (attached picture).
Please assist.
- Mark as New
- Bookmark
- Subscribe
- Mute
- Subscribe to RSS Feed
- Permalink
- Report Inappropriate Content
Hi,
I don't understand how to implement it.
I have Contracts, Spare Parts, Consumables, T&M for the chart.
How do I write expressions?
- Mark as New
- Bookmark
- Subscribe
- Mute
- Subscribe to RSS Feed
- Permalink
- Report Inappropriate Content
Agis and Massimo have both provided great solutions to your problem using the dual() function and then showing 'Values on Data Points' in the expressions tab. For more information you might consider taking the QlikView Designer Course which will teach you how to write expressions and build charts among other things. For more information see the course description below:
http://www.qlik.com/us/services/training/recommended-courses/courses/designer-version-11