Unlock a world of possibilities! Login now and discover the exclusive benefits awaiting you.
- Qlik Community
- :
- Discover
- :
- Programs
- :
- Education
- :
- Qlik Education Discussions
- :
- Which Chart to apply when we wanted a map ( attach...
Options
- Subscribe to RSS Feed
- Mark Topic as New
- Mark Topic as Read
- Float this Topic for Current User
- Bookmark
- Subscribe
- Mute
- Printer Friendly Page
Turn on suggestions
Auto-suggest helps you quickly narrow down your search results by suggesting possible matches as you type.
Showing results for
Partner - Contributor
2014-12-15
01:39 AM
- Mark as New
- Bookmark
- Subscribe
- Mute
- Subscribe to RSS Feed
- Permalink
- Report Inappropriate Content
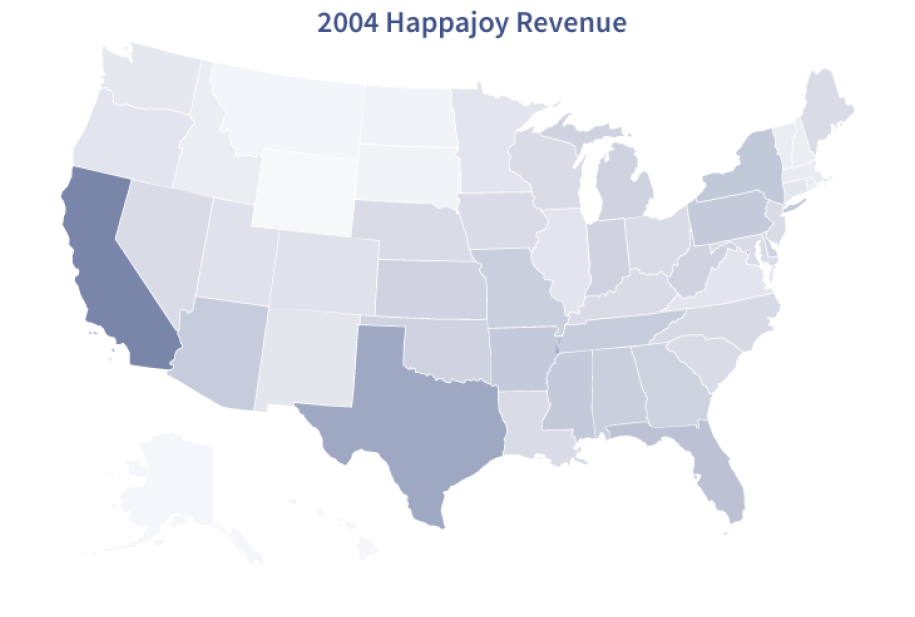
Which Chart to apply when we wanted a map ( attached *.PNG) that uses shading to represent Sales
Hello,
Can someone help me in deciding which chart to apply when there is a map that uses shading to represent sales in each state.
301 Views
1 Reply
2014-12-15
05:38 AM
- Mark as New
- Bookmark
- Subscribe
- Mute
- Subscribe to RSS Feed
- Permalink
- Report Inappropriate Content
In Qlikview you can use the SVG map extension to create such a map: http://branch.qlik.com/projects/showthread.php?136-SVG-Map-Extension
talk is cheap, supply exceeds demand
223 Views
Community Browser