Unlock a world of possibilities! Login now and discover the exclusive benefits awaiting you.
- Qlik Community
- :
- All Forums
- :
- QlikView App Dev
- :
- About Skew Function
- Subscribe to RSS Feed
- Mark Topic as New
- Mark Topic as Read
- Float this Topic for Current User
- Bookmark
- Subscribe
- Mute
- Printer Friendly Page
- Mark as New
- Bookmark
- Subscribe
- Mute
- Subscribe to RSS Feed
- Permalink
- Report Inappropriate Content
About Skew Function
Hi anyone can help me to understand the skew function were and all it can be used.
If any help thanks in advance
Harshitha
- Tags:
- new_to_qlikview
Accepted Solutions
- Mark as New
- Bookmark
- Subscribe
- Mute
- Subscribe to RSS Feed
- Permalink
- Report Inappropriate Content
Example:
Script:
Table:
LOAD * Inline [
Dim, Value
A, 10
B, 14
C, 9
A, 15
B, 14
C, 10
A, 20
B, 15
C, 15
A, 15
B, 16
C, 16
A, 15
B, 30
C, 16
];

- Mark as New
- Bookmark
- Subscribe
- Mute
- Subscribe to RSS Feed
- Permalink
- Report Inappropriate Content
For Skewness or Kurtosis:
- Mark as New
- Bookmark
- Subscribe
- Mute
- Subscribe to RSS Feed
- Permalink
- Report Inappropriate Content
Skewness's definition:
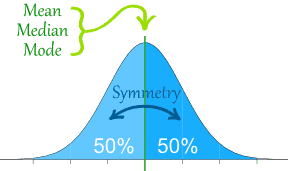
Skewness is a measure of symmetry, or more precisely, the lack of symmetry. A distribution, or data set, is symmetric if it looks the same to the left and right of the center point.
- Mark as New
- Bookmark
- Subscribe
- Mute
- Subscribe to RSS Feed
- Permalink
- Report Inappropriate Content
Hi Sunny thanks for your reply
where exactly this function can be used can u explain me in detail.
Thanks
Harshitha
- Mark as New
- Bookmark
- Subscribe
- Mute
- Subscribe to RSS Feed
- Permalink
- Report Inappropriate Content
Hi Sunny,If you can give an example it will be more helpful
- Mark as New
- Bookmark
- Subscribe
- Mute
- Subscribe to RSS Feed
- Permalink
- Report Inappropriate Content
check this thread
- Mark as New
- Bookmark
- Subscribe
- Mute
- Subscribe to RSS Feed
- Permalink
- Report Inappropriate Content
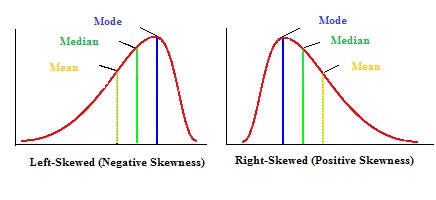
In context of QlikView I may not have a sample readily available. But this is a statistics concept related to Normal Distribution where a 0 skewed data will have Mean = Median = Mode. But a negatively or positively skewed data will not have them equal. Have a look at the image below
Working on a sample in the mean time 
- Mark as New
- Bookmark
- Subscribe
- Mute
- Subscribe to RSS Feed
- Permalink
- Report Inappropriate Content
Example:
Script:
Table:
LOAD * Inline [
Dim, Value
A, 10
B, 14
C, 9
A, 15
B, 14
C, 10
A, 20
B, 15
C, 15
A, 15
B, 16
C, 16
A, 15
B, 30
C, 16
];
- Mark as New
- Bookmark
- Subscribe
- Mute
- Subscribe to RSS Feed
- Permalink
- Report Inappropriate Content