Unlock a world of possibilities! Login now and discover the exclusive benefits awaiting you.
- Qlik Community
- :
- All Forums
- :
- QlikView App Dev
- :
- Advanced Chart Help
- Subscribe to RSS Feed
- Mark Topic as New
- Mark Topic as Read
- Float this Topic for Current User
- Bookmark
- Subscribe
- Mute
- Printer Friendly Page
- Mark as New
- Bookmark
- Subscribe
- Mute
- Subscribe to RSS Feed
- Permalink
- Report Inappropriate Content
Advanced Chart Help
Hello,
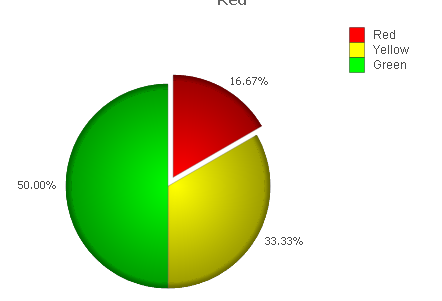
I need to achieve this chart...
Red= Red/(Red+Green+Yellow), Green= Green/(Red+Green+Yellow), Yellow=YellowR/(Red+Green+Yellow)
with the data below
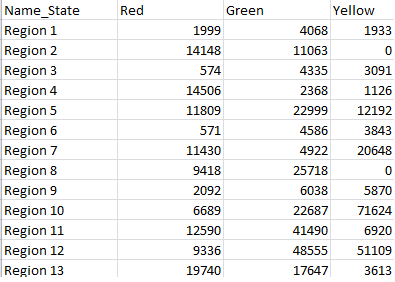
When none/all of the regions are selected the chart should display the calculated sum of all columns and a region is selected, the sum of corresponding column values is to be shown.
Can someone please help me out. I am quite new to QlikView and BI.
Thanks in advance.
PS: I don't even know how to frame this question, sorry.
- « Previous Replies
-
- 1
- 2
- Next Replies »
Accepted Solutions
- Mark as New
- Bookmark
- Subscribe
- Mute
- Subscribe to RSS Feed
- Permalink
- Report Inappropriate Content
Don' use Dimension
Use Expression
Sum(Red)/Sum(Red +Yellow+Green)
Sum(Yellow)/Sum(Red +Yellow+Green)
Sum(Green)/Sum(Red +Yellow+Green)
- Mark as New
- Bookmark
- Subscribe
- Mute
- Subscribe to RSS Feed
- Permalink
- Report Inappropriate Content
Hi
Please post sample data in excel sheet.
- Mark as New
- Bookmark
- Subscribe
- Mute
- Subscribe to RSS Feed
- Permalink
- Report Inappropriate Content
Here is the solution.
Regards,
Kaushik Solanki
- Mark as New
- Bookmark
- Subscribe
- Mute
- Subscribe to RSS Feed
- Permalink
- Report Inappropriate Content
Hey,
I have attached the excel sheet
- Mark as New
- Bookmark
- Subscribe
- Mute
- Subscribe to RSS Feed
- Permalink
- Report Inappropriate Content
Hey,
Thanks for the response. Unfortunately, I am running the personal edition of QlikView and hence cannot open the file. Can you please advice what to do?
Thanks
- Mark as New
- Bookmark
- Subscribe
- Mute
- Subscribe to RSS Feed
- Permalink
- Report Inappropriate Content
Hi,
Go to the Expression Tab. Under the Expression you created, there is + sign , expand this and you will see a Pie Popout option. Select this option and enter an expression such as len(your dimension) > 0 or sum(your expression) > 0.
Alternatively, just enter 1 in the popout option
- Mark as New
- Bookmark
- Subscribe
- Mute
- Subscribe to RSS Feed
- Permalink
- Report Inappropriate Content
I am just helping from Kaushik example for ref
Is this you are expecting? And your example is in image, Can you post same data in excel, May be to achieve this
- Mark as New
- Bookmark
- Subscribe
- Mute
- Subscribe to RSS Feed
- Permalink
- Report Inappropriate Content
Yes, This is what I am looking for. And the pie chart should change with relevant Region selection.
- Mark as New
- Bookmark
- Subscribe
- Mute
- Subscribe to RSS Feed
- Permalink
- Report Inappropriate Content
I appreciate your help, I am just a beginner. I dont know what expressions to use , itried many but failed.
- Mark as New
- Bookmark
- Subscribe
- Mute
- Subscribe to RSS Feed
- Permalink
- Report Inappropriate Content
also , how can I attach excel sheet here in the discussion? Please help me.
- « Previous Replies
-
- 1
- 2
- Next Replies »