Unlock a world of possibilities! Login now and discover the exclusive benefits awaiting you.
- Qlik Community
- :
- All Forums
- :
- QlikView App Dev
- :
- Re: Bar Chart Reference Line Label
- Subscribe to RSS Feed
- Mark Topic as New
- Mark Topic as Read
- Float this Topic for Current User
- Bookmark
- Subscribe
- Mute
- Printer Friendly Page
- Mark as New
- Bookmark
- Subscribe
- Mute
- Subscribe to RSS Feed
- Permalink
- Report Inappropriate Content
Bar Chart Reference Line Label
Hi all,
How can we solve the problem in the attached document?
Thanks...
Accepted Solutions
- Mark as New
- Bookmark
- Subscribe
- Mute
- Subscribe to RSS Feed
- Permalink
- Report Inappropriate Content
Hi, Could you try this?
Max(Aggr(sum(value1) / sum(value2),MonthDate )) & ' Max Month : ' & FirstSortedValue(MonthDate, -(value1/value2))
Regards
- Mark as New
- Bookmark
- Subscribe
- Mute
- Subscribe to RSS Feed
- Permalink
- Report Inappropriate Content
what is the problem. can you pls brief.
- Mark as New
- Bookmark
- Subscribe
- Mute
- Subscribe to RSS Feed
- Permalink
- Report Inappropriate Content
in chart properties->presentation->Reference line. based on condition the reference line will be shown in bar chart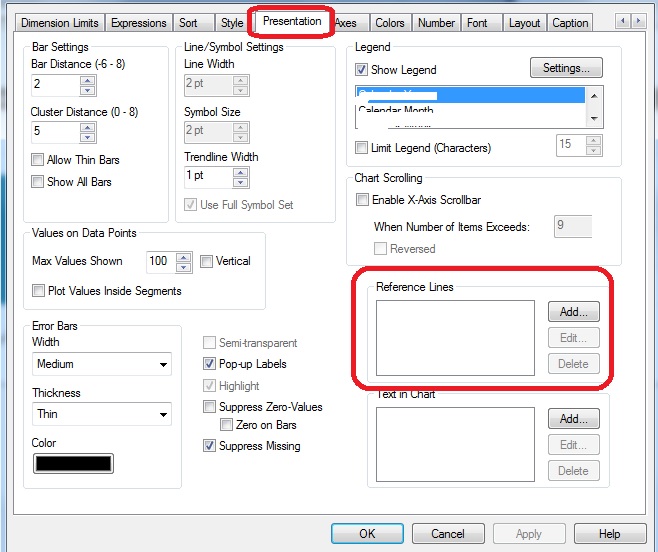
- Mark as New
- Bookmark
- Subscribe
- Mute
- Subscribe to RSS Feed
- Permalink
- Report Inappropriate Content
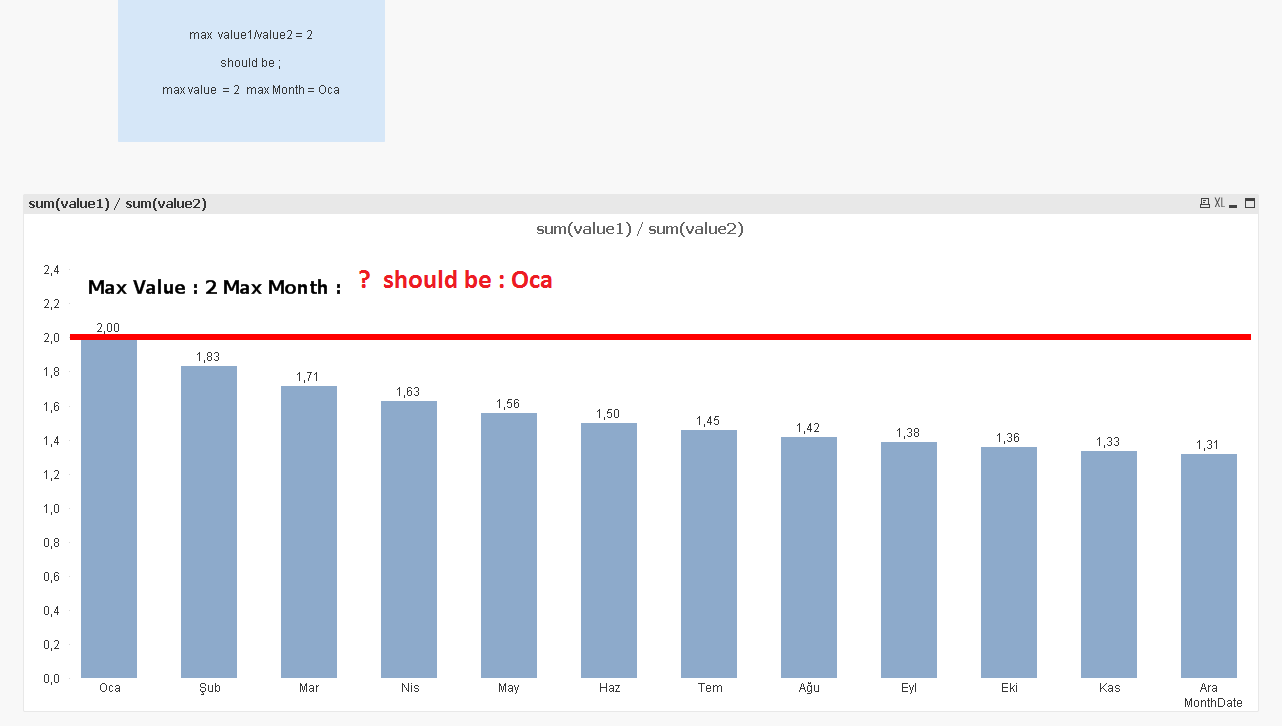
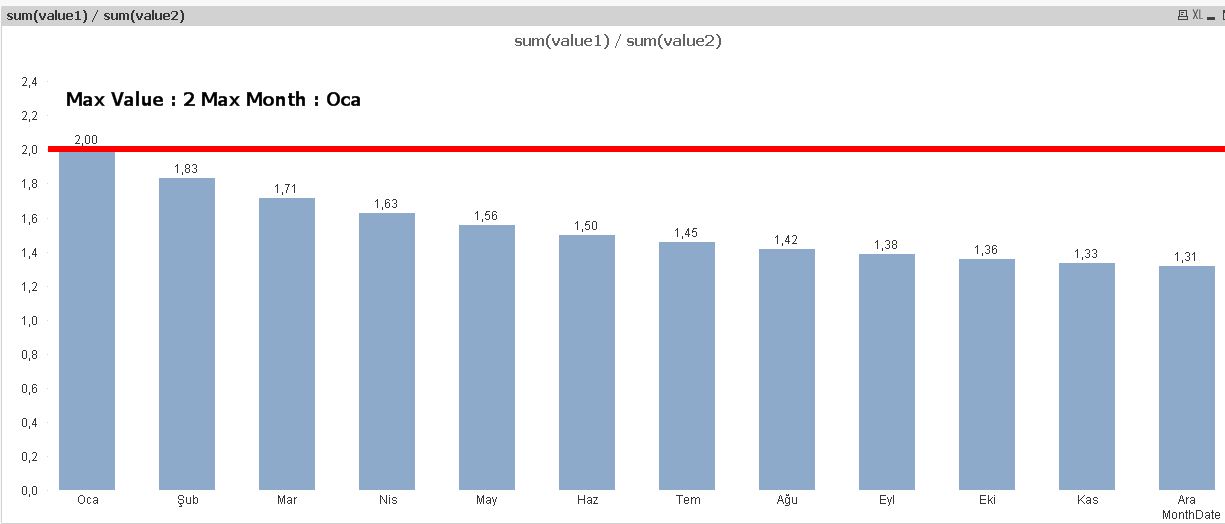
Max value : 2 and should be max Month = Oca
- Mark as New
- Bookmark
- Subscribe
- Mute
- Subscribe to RSS Feed
- Permalink
- Report Inappropriate Content
Try to enable the option 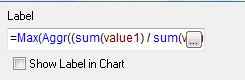
- Mark as New
- Bookmark
- Subscribe
- Mute
- Subscribe to RSS Feed
- Permalink
- Report Inappropriate Content
Label enable ok.
I do not calculate the date (max Month) information
- Mark as New
- Bookmark
- Subscribe
- Mute
- Subscribe to RSS Feed
- Permalink
- Report Inappropriate Content

- Mark as New
- Bookmark
- Subscribe
- Mute
- Subscribe to RSS Feed
- Permalink
- Report Inappropriate Content
Hi, Could you try this?
Max(Aggr(sum(value1) / sum(value2),MonthDate )) & ' Max Month : ' & FirstSortedValue(MonthDate, -(value1/value2))
Regards
- Mark as New
- Bookmark
- Subscribe
- Mute
- Subscribe to RSS Feed
- Permalink
- Report Inappropriate Content
='Max Value : ' & Max(Aggr(sum(value1) / sum(value2),MonthDate )) & ' Max Month : ' & FirstSortedValue(MonthDate, -Aggr(sum(value1) / sum(value2),MonthDate ))

hope this helps
regards
Marco
- Mark as New
- Bookmark
- Subscribe
- Mute
- Subscribe to RSS Feed
- Permalink
- Report Inappropriate Content
If
FirstSortedValue(MonthDate, -(value1/value2))
matches your requirements, then there is only one value1/value2 combination per month in your data, which means that you could also abbreviate your other expressions like:
=Max(value1/value2)
for the reference line and
='Max Value : ' & Max(value1/value2) & ' Max Month : ' & FirstSortedValue(MonthDate, -(value1/value2))
for the text in chart.
hope this helps
regards
Marco