Unlock a world of possibilities! Login now and discover the exclusive benefits awaiting you.
- Qlik Community
- :
- All Forums
- :
- QlikView App Dev
- :
- Re: Bar display one-on-one
- Subscribe to RSS Feed
- Mark Topic as New
- Mark Topic as Read
- Float this Topic for Current User
- Bookmark
- Subscribe
- Mute
- Printer Friendly Page
- Mark as New
- Bookmark
- Subscribe
- Mute
- Subscribe to RSS Feed
- Permalink
- Report Inappropriate Content
Bar display one-on-one
Hello,
I've a table with fields Date and value. I want to display the sum of the value based on dimension date(i.e. first half one part, second half another part).
For eg:
Jan-Aug->4000
Sept-Dec->2000
Jan-Dec ->6000
The chart should look like this:
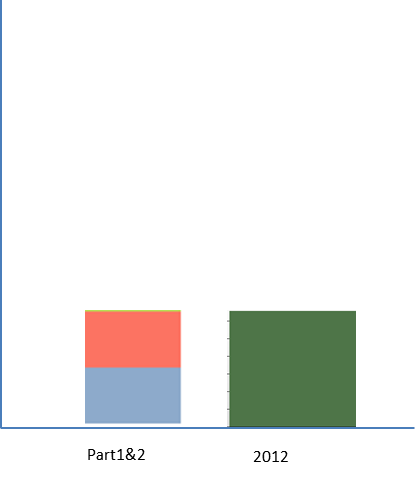
- The blue color shows data of value from jan to aug, red from sept to dec. Green shows entire data for 2012.
How can i achive this.
Accepted Solutions
- Mark as New
- Bookmark
- Subscribe
- Mute
- Subscribe to RSS Feed
- Permalink
- Report Inappropriate Content
Slight adjustment to the dimension names...
- Mark as New
- Bookmark
- Subscribe
- Mute
- Subscribe to RSS Feed
- Permalink
- Report Inappropriate Content
Please post your app.
- Mark as New
- Bookmark
- Subscribe
- Mute
- Subscribe to RSS Feed
- Permalink
- Report Inappropriate Content
Please check enclosed app.
- Mark as New
- Bookmark
- Subscribe
- Mute
- Subscribe to RSS Feed
- Permalink
- Report Inappropriate Content
How's this?
- Mark as New
- Bookmark
- Subscribe
- Mute
- Subscribe to RSS Feed
- Permalink
- Report Inappropriate Content
Slight adjustment to the dimension names...
- Mark as New
- Bookmark
- Subscribe
- Mute
- Subscribe to RSS Feed
- Permalink
- Report Inappropriate Content
I find the solution in best way i think so. Please check the file once.
- Mark as New
- Bookmark
- Subscribe
- Mute
- Subscribe to RSS Feed
- Permalink
- Report Inappropriate Content
i have never used the function valuelist & didnt even find Qv help. can u explain y we use this
- Mark as New
- Bookmark
- Subscribe
- Mute
- Subscribe to RSS Feed
- Permalink
- Report Inappropriate Content
Your script is only using Month() therefore the same months in different years will be grouped together:
If(Year(DateField)=Year(Today()),'Actual/Projected') as "Actual/Projected",
If(Month(DateField)*1<$(vCurrentMonth),'Actual','Projected') as FleetCapacity,
Maybe try:
LET vCurrentMonth= Today();
If(Year(DateField)=Year(Today()),'Actual/Projected') as "Actual/Projected",
If(DateField<$(vCurrentMonth),'Actual','Projected') as FleetCapacity,
- Mark as New
- Bookmark
- Subscribe
- Mute
- Subscribe to RSS Feed
- Permalink
- Report Inappropriate Content
It's in the help - look for "Synthetic Dimensions"