Unlock a world of possibilities! Login now and discover the exclusive benefits awaiting you.
- Qlik Community
- :
- All Forums
- :
- QlikView App Dev
- :
- Re: Chart Columms Problem
- Subscribe to RSS Feed
- Mark Topic as New
- Mark Topic as Read
- Float this Topic for Current User
- Bookmark
- Subscribe
- Mute
- Printer Friendly Page
- Mark as New
- Bookmark
- Subscribe
- Mute
- Subscribe to RSS Feed
- Permalink
- Report Inappropriate Content
Chart Columms Problem
Hello everyone,
I have a small problem and I don´tt know how to fix it, I hope you can help me.
I have a table with three columns,
1. Name
2. Number of months
3.Years
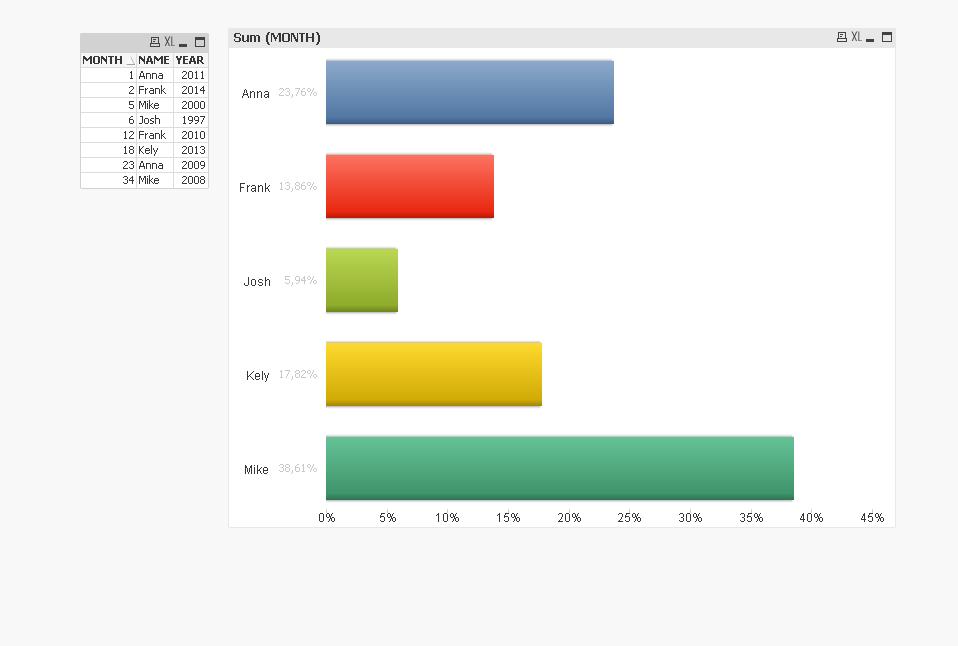
I created a Chart name based on the size and the expression Sum ([MONTH])
I wan to display only the names from a given year, 2009 or 2010.....
Any ideas?
Thank You,
- « Previous Replies
-
- 1
- 2
- Next Replies »
Accepted Solutions
- Mark as New
- Bookmark
- Subscribe
- Mute
- Subscribe to RSS Feed
- Permalink
- Report Inappropriate Content
- Mark as New
- Bookmark
- Subscribe
- Mute
- Subscribe to RSS Feed
- Permalink
- Report Inappropriate Content
Hi Qlik-Test,
Can you send us a sample app ?
It will easier to help you.
François
- Mark as New
- Bookmark
- Subscribe
- Mute
- Subscribe to RSS Feed
- Permalink
- Report Inappropriate Content

Hi Francois,
Sure, sorry about it,
If you need more information, please let me know.
Albert
- Mark as New
- Bookmark
- Subscribe
- Mute
- Subscribe to RSS Feed
- Permalink
- Report Inappropriate Content
Albert,
I don't understand what do you analyse...
But this expression below is maybe good for you :
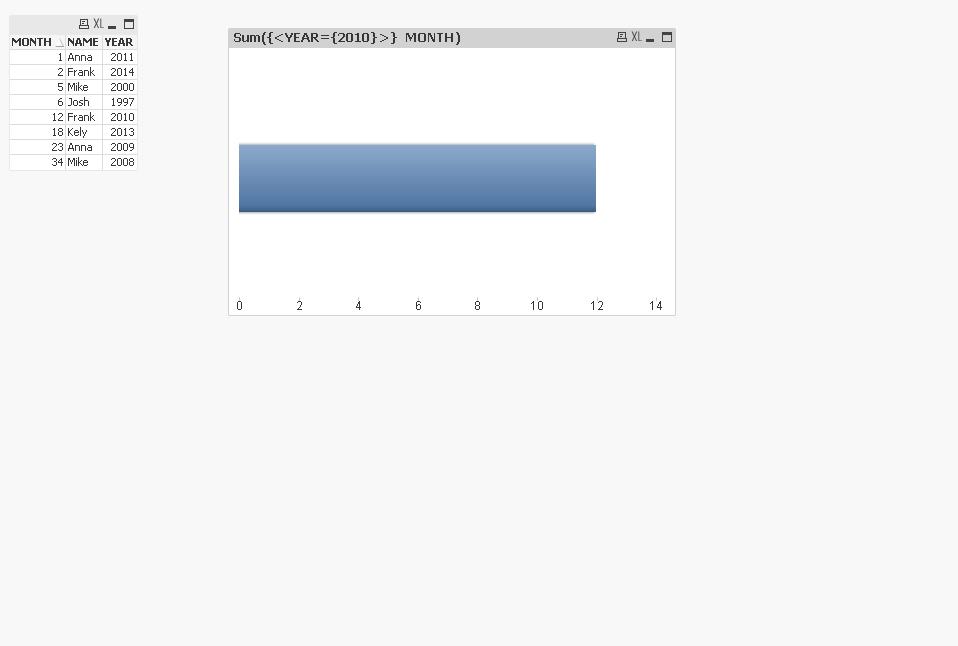
Sum({<YEAR={2010}>} Month)
More information about set analysis (by Fabrice Aunez): Set Analysis: syntaxes, examples
It's what do you expect ?
François
- Mark as New
- Bookmark
- Subscribe
- Mute
- Subscribe to RSS Feed
- Permalink
- Report Inappropriate Content
Hi again,
i want to have a chart that show the information from one year. In teory it is a easy thing.....
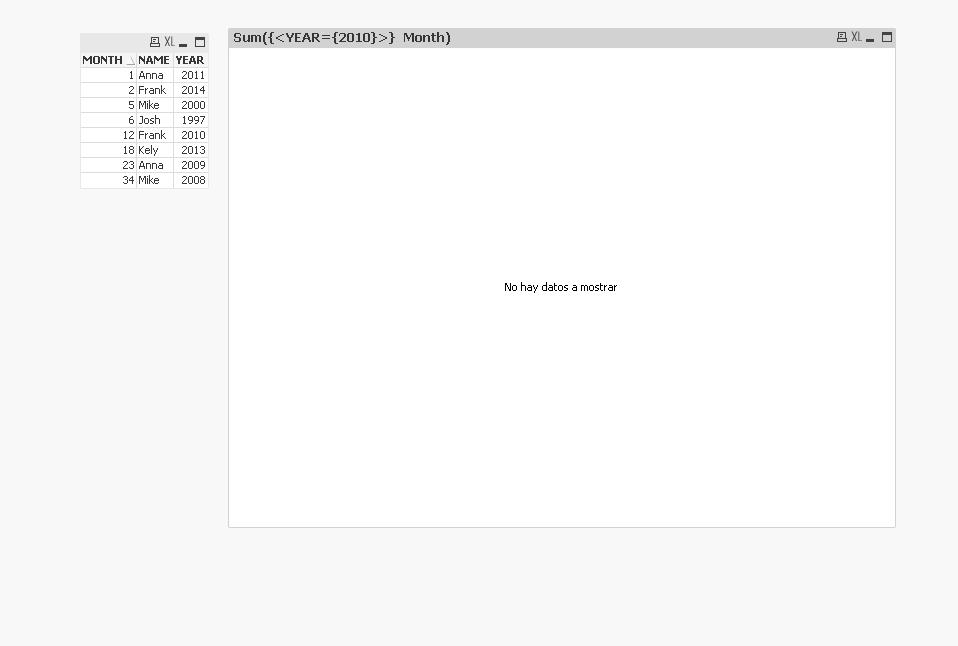
Your expression is not working (but it is the thing that i am looking for)
With it expression the result is

- Mark as New
- Bookmark
- Subscribe
- Mute
- Subscribe to RSS Feed
- Permalink
- Report Inappropriate Content
Albert,
It's work for me...
See the attached file.
François
- Mark as New
- Bookmark
- Subscribe
- Mute
- Subscribe to RSS Feed
- Permalink
- Report Inappropriate Content
Hi again,
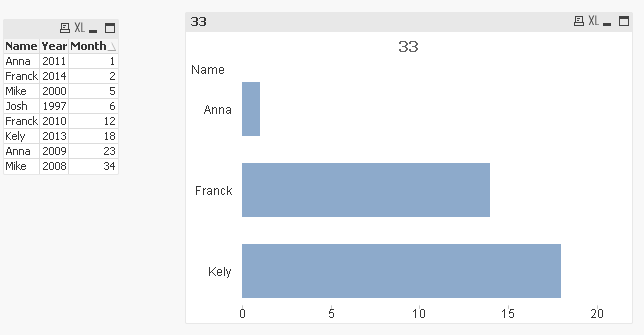
I found half of the problem (the Month name). Now i can see only one year, but i need to see all the years from 2010.

- Mark as New
- Bookmark
- Subscribe
- Mute
- Subscribe to RSS Feed
- Permalink
- Report Inappropriate Content
Albert,
See the attached file 😉
François
- Mark as New
- Bookmark
- Subscribe
- Mute
- Subscribe to RSS Feed
- Permalink
- Report Inappropriate Content
Hi,
Sorry but I can not open your file. can you please tell me the expression?
Thanks in advance,
Albert
- Mark as New
- Bookmark
- Subscribe
- Mute
- Subscribe to RSS Feed
- Permalink
- Report Inappropriate Content
Albert,
=Sum({<Year={">= 2010"}>} Month)
Tell me if it's good with this expression.
François
- « Previous Replies
-
- 1
- 2
- Next Replies »
