Unlock a world of possibilities! Login now and discover the exclusive benefits awaiting you.
- Qlik Community
- :
- All Forums
- :
- QlikView App Dev
- :
- Re: Chart & Graph differences
- Subscribe to RSS Feed
- Mark Topic as New
- Mark Topic as Read
- Float this Topic for Current User
- Bookmark
- Subscribe
- Mute
- Printer Friendly Page
- Mark as New
- Bookmark
- Subscribe
- Mute
- Subscribe to RSS Feed
- Permalink
- Report Inappropriate Content
Chart & Graph differences
Dear Community,
I'm trying to create a combo graph with a bar and line graph but something strange is happening. If I display my information as a chart I get the below table:

But when I put this into a graph I get this:
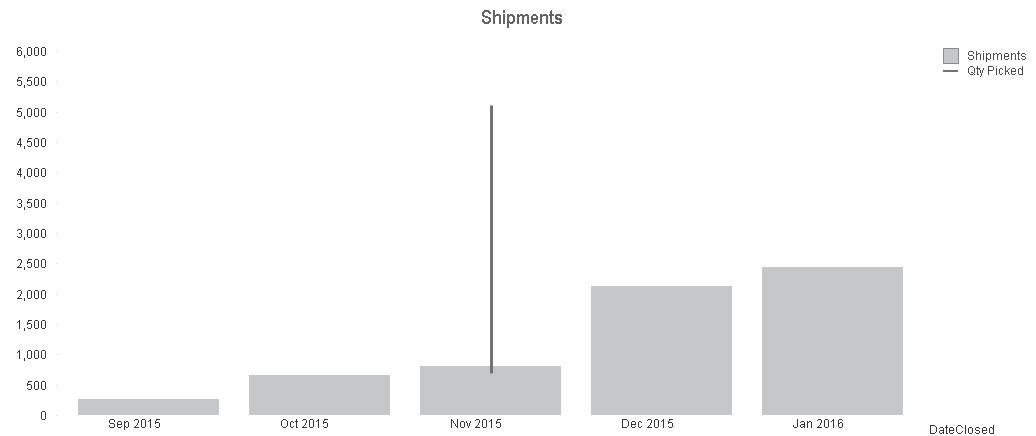
The expression causing me issues is below:
=sum(aggr(max(if(DateClosed>=addmonths(vStartDate,-11) AND DateClosed<=vEndDate,LineQty)),ShipmentId))
If you hover over that line it shows different data points but they aren't correlating to the dimension
=MonthName(floor(DateClosed))
Any ideas?
- Mark as New
- Bookmark
- Subscribe
- Mute
- Subscribe to RSS Feed
- Permalink
- Report Inappropriate Content
Would you be able to share a sample?
- Mark as New
- Bookmark
- Subscribe
- Mute
- Subscribe to RSS Feed
- Permalink
- Report Inappropriate Content
Your aggr included not the dimension from chart. This wouldn't work in your case because it's a calculated dimension - suggestion here is to create all needed period-fields within a master-calendar: How to use - Master-Calendar and Date-Values - further noticeable is that you used floor for your DateClosed which indicates that it is timestamp, to compare dates with timestamps is possible but unnecessary error-prone.
- Marcus