Unlock a world of possibilities! Login now and discover the exclusive benefits awaiting you.
- Qlik Community
- :
- All Forums
- :
- QlikView App Dev
- :
- Re: Convert Table Expression to Text Box
- Subscribe to RSS Feed
- Mark Topic as New
- Mark Topic as Read
- Float this Topic for Current User
- Bookmark
- Subscribe
- Mute
- Printer Friendly Page
- Mark as New
- Bookmark
- Subscribe
- Mute
- Subscribe to RSS Feed
- Permalink
- Report Inappropriate Content
Convert Table Expression to Text Box
I have a table with the following:
DIMENSIONS:
DEFECT_ID
=if(match(COM_CAT,'Solution Design Group')>0,date(COM_CAT_START_DATE))
=if(match(COM_CAT,'Solution Design Group')>0,date(COM_CAT_END_DATE))
EXPRESSION:
sum({$<[COM_CAT]= {'Solution Design Group'}>}date(COM_CAT_END_DATE))-sum({$<[COM_CAT]= {'Solution Design Group'}>}date(COM_CAT_START_DATE))
The numbers have been validated (Avg of 142 days). I need to convert this chart into a text box to be used as a KPI and I can't figure out the right syntax...
Something with AVG(AGGR) I would assume but this is NOT right:
=avg(aggr(sum({$<[COM_CAT]= {'Solution Design Group'}>}date(COM_CAT_END_DATE))-sum({$<[COM_CAT]= {'Solution Design Group'}>}date(COM_CAT_START_DATE)),DEFECT_ID))
Any help is appreciated! Thanks!
Accepted Solutions
- Mark as New
- Bookmark
- Subscribe
- Mute
- Subscribe to RSS Feed
- Permalink
- Report Inappropriate Content
Try this
=Avg(Aggr(Sum({$<[COM_CAT] = {'Solution Design Group'}, COM_CAT_END_DATE = {"*"}, COM_CAT_START_DATE = {"*"}>} COM_CAT_END_DATE) -
Sum({$<[COM_CAT] = {'Solution Design Group'}, COM_CAT_END_DATE = {"*"}, COM_CAT_START_DATE = {"*"}>} COM_CAT_START_DATE), DEFECT_ID, COM_CAT_START_DATE, COM_CAT_END_DATE))
- Mark as New
- Bookmark
- Subscribe
- Mute
- Subscribe to RSS Feed
- Permalink
- Report Inappropriate Content
May be this
=Avg(Aggr(Sum({$<[COM_CAT] = {'Solution Design Group'}>} COM_CAT_END_DATE) - Sum({$<[COM_CAT] = {'Solution Design Group'}>} COM_CAT_START_DATE), DEFECT_ID, COM_CAT_START_DATE, COM_CAT_END_DATE))
- Mark as New
- Bookmark
- Subscribe
- Mute
- Subscribe to RSS Feed
- Permalink
- Report Inappropriate Content
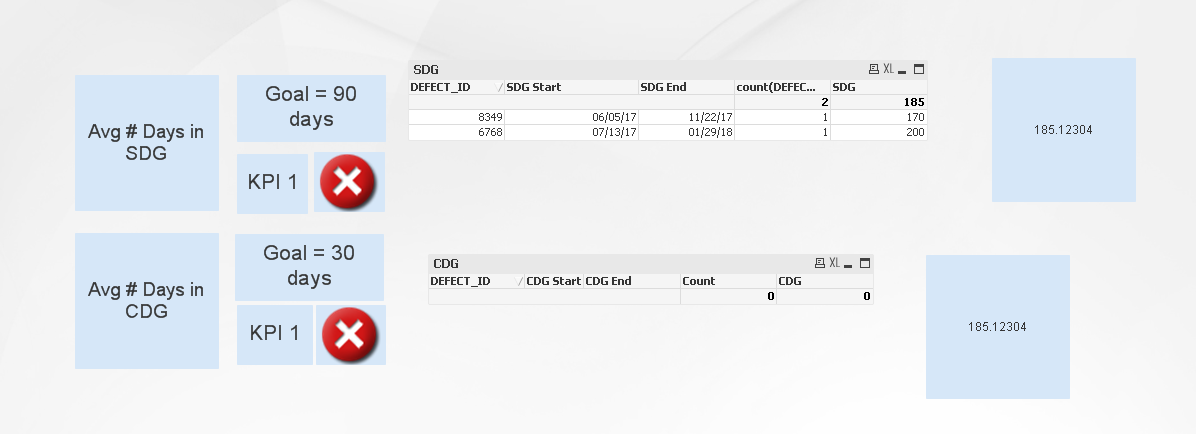
Here is a sample file. When I apply your expression I get -12736.
- Mark as New
- Bookmark
- Subscribe
- Mute
- Subscribe to RSS Feed
- Permalink
- Report Inappropriate Content
Where do I see this -12736 number?
- Mark as New
- Bookmark
- Subscribe
- Mute
- Subscribe to RSS Feed
- Permalink
- Report Inappropriate Content
I think the selections need to be cleared.
- Mark as New
- Bookmark
- Subscribe
- Mute
- Subscribe to RSS Feed
- Permalink
- Report Inappropriate Content
Try this
=Avg(Aggr(Sum({$<[COM_CAT] = {'Solution Design Group'}, COM_CAT_END_DATE = {"*"}, COM_CAT_START_DATE = {"*"}>} COM_CAT_END_DATE) -
Sum({$<[COM_CAT] = {'Solution Design Group'}, COM_CAT_END_DATE = {"*"}, COM_CAT_START_DATE = {"*"}>} COM_CAT_START_DATE), DEFECT_ID, COM_CAT_START_DATE, COM_CAT_END_DATE))
- Mark as New
- Bookmark
- Subscribe
- Mute
- Subscribe to RSS Feed
- Permalink
- Report Inappropriate Content
thank you!