Unlock a world of possibilities! Login now and discover the exclusive benefits awaiting you.
- Qlik Community
- :
- All Forums
- :
- QlikView App Dev
- :
- Re: Count if sum(value) ist not 0
- Subscribe to RSS Feed
- Mark Topic as New
- Mark Topic as Read
- Float this Topic for Current User
- Bookmark
- Subscribe
- Mute
- Printer Friendly Page
- Mark as New
- Bookmark
- Subscribe
- Mute
- Subscribe to RSS Feed
- Permalink
- Report Inappropriate Content
Count if sum(value) ist not 0
Hi Community,
I have the following scenario. I want to create a chart that shows the distribution of products within a project.
The condition is that the sum of the amount for a specific type should not be 0.
| Project | Product | Type | Amount |
| S3 | P_A | BUD | 100 |
| S3 | P_B | BUD | 15 |
| S3 | P_D | BUD | 50 |
| S3 | P_D | BUD | -50 |
I expect a chart with dimension = "2" (count of different products <> 0) and the expression = 1 (count of projects).
The dimension looks like this:
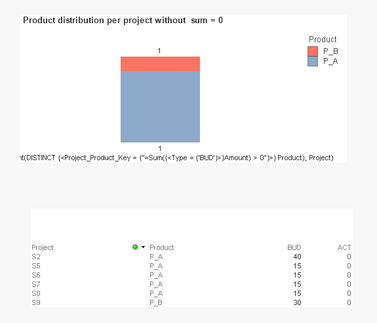
aggr( Count(DISTINCT {<Product = {"=aggr(Sum({<Type = {'BUD'}>}Amount),Project, Product) > 0"}>} Product), Project) but it only works when one project is selected. For multiple projects, it shows an empty value. I am attaching a working example of what I have achieved so far. I think I am quite near, any ideas?
- « Previous Replies
-
- 1
- 2
- Next Replies »
- Mark as New
- Bookmark
- Subscribe
- Mute
- Subscribe to RSS Feed
- Permalink
- Report Inappropriate Content
Sorry, not yet, the expression returns always 1.
- Mark as New
- Bookmark
- Subscribe
- Mute
- Subscribe to RSS Feed
- Permalink
- Report Inappropriate Content
Would you be able to share a sample where we need to have more than one Project? I think the sample always have 1 project for each count(Product).
- Mark as New
- Bookmark
- Subscribe
- Mute
- Subscribe to RSS Feed
- Permalink
- Report Inappropriate Content
- Mark as New
- Bookmark
- Subscribe
- Mute
- Subscribe to RSS Feed
- Permalink
- Report Inappropriate Content
Check attached
- Mark as New
- Bookmark
- Subscribe
- Mute
- Subscribe to RSS Feed
- Permalink
- Report Inappropriate Content
Hi Sunny,
see attached QVW and image, the count is still not returning the correct value.
- Mark as New
- Bookmark
- Subscribe
- Mute
- Subscribe to RSS Feed
- Permalink
- Report Inappropriate Content
Don't think this is possible. but may be someone might have another trick to do this
- Mark as New
- Bookmark
- Subscribe
- Mute
- Subscribe to RSS Feed
- Permalink
- Report Inappropriate Content
Thanks for the help. I decided to use 2 overlapped charts to achieve the goal. 😃
- « Previous Replies
-
- 1
- 2
- Next Replies »

