Unlock a world of possibilities! Login now and discover the exclusive benefits awaiting you.
- Qlik Community
- :
- All Forums
- :
- QlikView App Dev
- :
- Re: Custom Problem
- Subscribe to RSS Feed
- Mark Topic as New
- Mark Topic as Read
- Float this Topic for Current User
- Bookmark
- Subscribe
- Mute
- Printer Friendly Page
- Mark as New
- Bookmark
- Subscribe
- Mute
- Subscribe to RSS Feed
- Permalink
- Report Inappropriate Content
Custom Problem
Hello,
Why this line is not mixing properly..
- « Previous Replies
- Next Replies »
Accepted Solutions
- Mark as New
- Bookmark
- Subscribe
- Mute
- Subscribe to RSS Feed
- Permalink
- Report Inappropriate Content
Anil, see attachment, but, please, read the links I have mentioned below, it is all explained there.
Regards
- Mark as New
- Bookmark
- Subscribe
- Mute
- Subscribe to RSS Feed
- Permalink
- Report Inappropriate Content
check the boundaries of your barchart (strg+shift) it looks like the Limits of the barchart is to large
you may Position the barchart after strg+shift
- Mark as New
- Bookmark
- Subscribe
- Mute
- Subscribe to RSS Feed
- Permalink
- Report Inappropriate Content
Hi Anil,
Set the background of your objects to transparent:
Regards!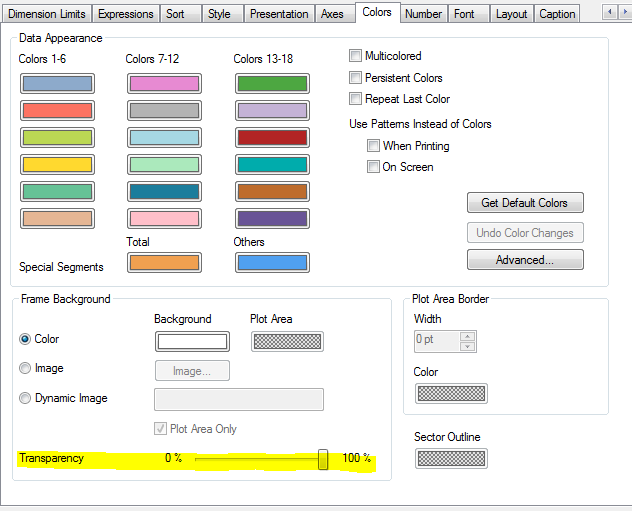
- Mark as New
- Bookmark
- Subscribe
- Mute
- Subscribe to RSS Feed
- Permalink
- Report Inappropriate Content
Manuel,
Got it.
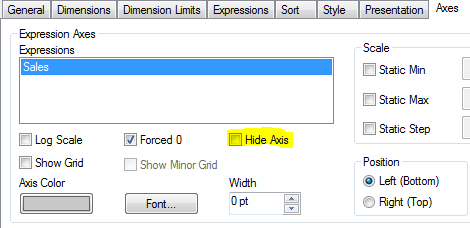
1) How to remove the Y-Axis of Dots
2) I want to show some space in between of -100 , -200 ...
- Anil
- Mark as New
- Bookmark
- Subscribe
- Mute
- Subscribe to RSS Feed
- Permalink
- Report Inappropriate Content
Hi Anil,
For remove Axis:
For space between steps: and on static steps 50, and check it.
Regards!
- Mark as New
- Bookmark
- Subscribe
- Mute
- Subscribe to RSS Feed
- Permalink
- Report Inappropriate Content
Manuel,
I don't want to hide any Any Axis. I want to hide only Dots...
If i put Static Step as 50, Here no response ....
- Mark as New
- Bookmark
- Subscribe
- Mute
- Subscribe to RSS Feed
- Permalink
- Report Inappropriate Content
Hi Anil,
This dots can be removed changing the colour to 100% transparency on Axis colour:
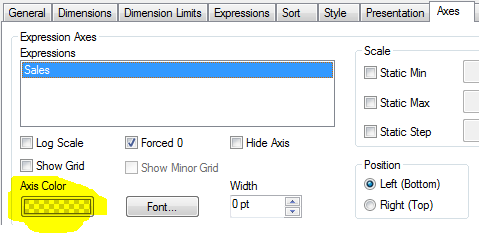
The space between this is automatic, you can modify this scale on Scale options, but size between it is automatic.
Regards!
- Mark as New
- Bookmark
- Subscribe
- Mute
- Subscribe to RSS Feed
- Permalink
- Report Inappropriate Content
Manuel,
1) If we put 100 % Transparency, There is not problem in future, Right?
2) Because, While i am trying to use the Grid, It's not working after i changed to 100% Transparency.
3) X- Axis grid is working. But, y-axis grid is not working...
- Anil
- Mark as New
- Bookmark
- Subscribe
- Mute
- Subscribe to RSS Feed
- Permalink
- Report Inappropriate Content
Grid is continuation of this dots, with same colour. If this colour is 100% transparency you will not see the grid.
Regards!
- Mark as New
- Bookmark
- Subscribe
- Mute
- Subscribe to RSS Feed
- Permalink
- Report Inappropriate Content
Hi,
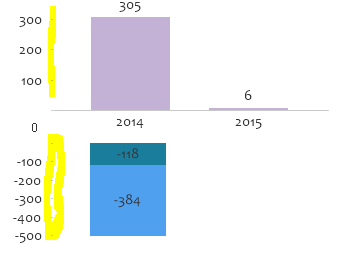
1) If i take 100% Transparency for the above graph(+) not showing any Pop-Up values. It covers whole into Text object only
2) For the below graph(-). Here it showing good Pop-Up.
3) I want to show same as + Graph also..
Please help me Guys??
- Anil
- « Previous Replies
- Next Replies »